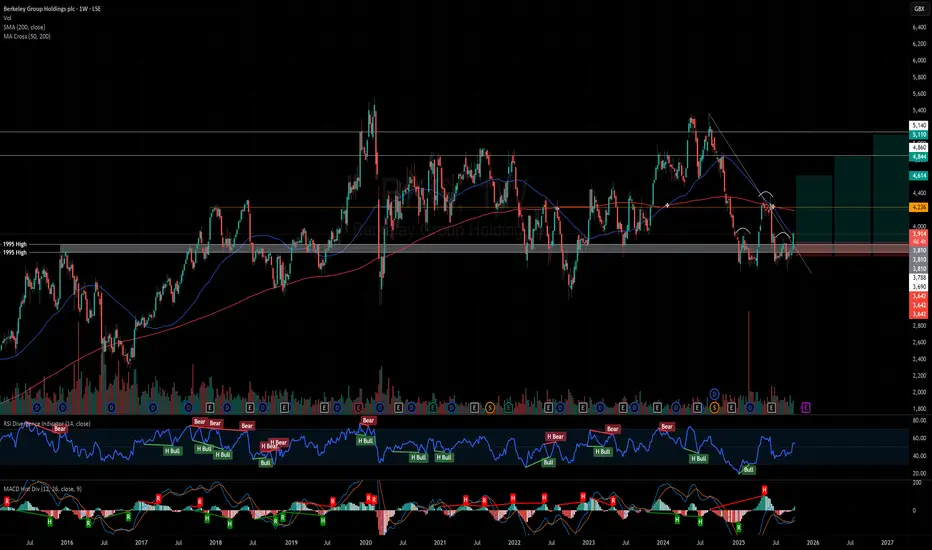
Berkeley Group Yearly ChartSee how this support holds up next year goes has been ranging for some time.
Berkeley Group Holdings Plc.
No trades
Next report date
—
Report period
—
EPS estimate
—
Revenue estimate
—
4.85 USD
508.98 M USD
3.31 B USD
91.58 M
About Berkeley Group Holdings plc
Sector
Industry
CEO
Richard James Stearn
Website
Headquarters
Cobham
Founded
2004
IPO date
Jan 6, 1986
Identifiers
2
ISIN GB00BP0RGD03
Berkeley Group Holdings Plc engages in the development of residential and mixed-use properties. It operates through the following brands: Berkeley, St. James, St. George, St. Edward, St. Joseph, and St. William. The company was founded by Anthony William Pidgley and Jim Farrer in 1976 and is headquartered in Cobham, the United Kingdom.
Related stocks

BKG - Enter at or as close to support as possibleUK Reit - BKG
Looks like a failed head and shoulders pattern, turning into a dragon pattern at historical resistance/support.
Break of trendline.
Sellers looking exhausted on oscillators.
Strong weekly candle, but wait for pullback before entering, or DCA down to entry price to manage risk.
Expec
BKG LongPrice going into attractive buying zone
Major catalyst - chancellor announces more support for first time buyers (5% mortgages should become more common)
Price decline has been part of a broader market correction (no specific company / industry news that provides clear rationale for the stock to be


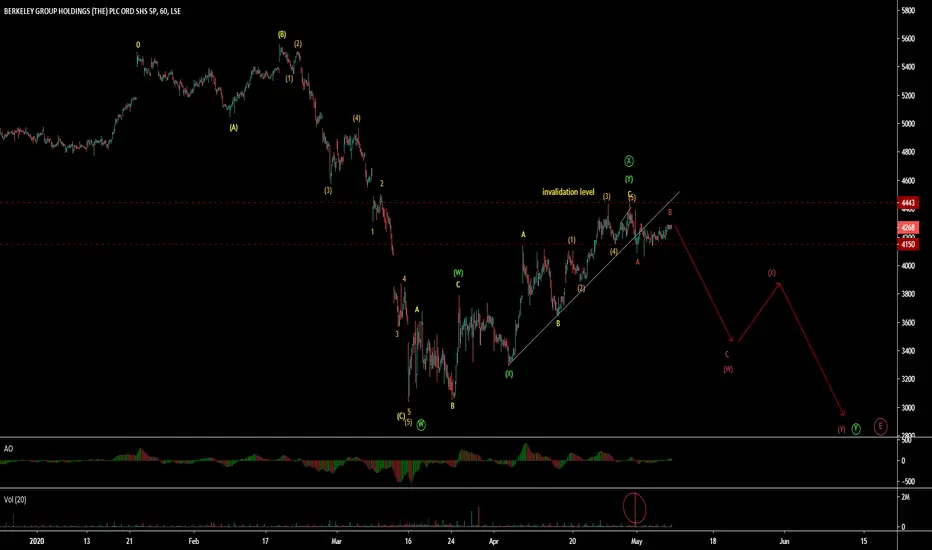
Berkeley Group Holdings PLC (BKG - LSE) - WXY wave patternBerkeley Group Holdings PLC (BKG - LSE) is in WXY complex correction pattern. W is elongated zigzag followed by X wave as double three correction, which is over. Y wave down is in progress which dropped with large volume. Wave B is about to over.

BKG Consolidation Buy RR 5:1Berkeley group holdings has formed a new resistance level @ 3837 and is consolidating in the range of 3717 - 3837, this is tight consolidation which will lead to momentum upwards once it breaks resistance.
My game plan would be the following:
Trigger Price: 3837
TP: 4344
SL: 3717
RR: 5:1

BKG Inverse Head & Shoulders BuyBKG Has formed an inverse head and shoulders pattern with a resistance of 3751. There's also been some tight consolidation leading to a breakout, which is over the 50 day SMA. 14 day SMA was acting as resistance but is now support and the 7 day SMA is making a bullish move and almost taking over the

Berkeley Group Pulls BackThis stock is featuring for the first time on our TradingView blogs.
Current setup: Price is currently performing a pullback.
Conclusion: We should wait for price to find support and head back to the upside. Long trades can be considered after a break of the resistance level. Stay patient and let


See all ideas
Summarizing what the indicators are suggesting.
Neutral
SellBuy
Strong sellStrong buy
Strong sellSellNeutralBuyStrong buy
Neutral
SellBuy
Strong sellStrong buy
Strong sellSellNeutralBuyStrong buy
Neutral
SellBuy
Strong sellStrong buy
Strong sellSellNeutralBuyStrong buy
An aggregate view of professional's ratings.
Neutral
SellBuy
Strong sellStrong buy
Strong sellSellNeutralBuyStrong buy
Neutral
SellBuy
Strong sellStrong buy
Strong sellSellNeutralBuyStrong buy
Neutral
SellBuy
Strong sellStrong buy
Strong sellSellNeutralBuyStrong buy
Displays a symbol's price movements over previous years to identify recurring trends.
ISFD
iShares PLC - iShares Core FTSE 100 UCITS ETF Accum Hedged USDWeight
0.16%
Market value
32.24 M
USD
Explore more ETFs
Frequently Asked Questions
The current price of BKGFF is 49.44 USD — it has increased by 2.37% in the past 24 hours. Watch Berkeley Group Holdings Plc. stock price performance more closely on the chart.
Depending on the exchange, the stock ticker may vary. For instance, on OTC exchange Berkeley Group Holdings Plc. stocks are traded under the ticker BKGFF.
We've gathered analysts' opinions on Berkeley Group Holdings Plc. future price: according to them, BKGFF price has a max estimate of 71.62 USD and a min estimate of 51.41 USD. Watch BKGFF chart and read a more detailed Berkeley Group Holdings Plc. stock forecast: see what analysts think of Berkeley Group Holdings Plc. and suggest that you do with its stocks.
BKGFF reached its all-time high on Feb 22, 2008 with the price of 1,041.14 USD, and its all-time low was 8.20 USD and was reached on May 29, 2008. View more price dynamics on BKGFF chart.
See other stocks reaching their highest and lowest prices.
See other stocks reaching their highest and lowest prices.
BKGFF stock is 2.32% volatile and has beta coefficient of 0.74. Track Berkeley Group Holdings Plc. stock price on the chart and check out the list of the most volatile stocks — is Berkeley Group Holdings Plc. there?
Today Berkeley Group Holdings Plc. has the market capitalization of 5.64 B, it has decreased by −2.44% over the last week.
Yes, you can track Berkeley Group Holdings Plc. financials in yearly and quarterly reports right on TradingView.
Berkeley Group Holdings Plc. is going to release the next earnings report on Jun 24, 2026. Keep track of upcoming events with our Earnings Calendar.
BKGFF earnings for the last half-year are 2.41 USD per share, whereas the estimation was 2.40 USD, resulting in a 0.59% surprise. The estimated earnings for the next half-year are 2.04 USD per share. See more details about Berkeley Group Holdings Plc. earnings.
Berkeley Group Holdings Plc. revenue for the last half-year amounts to 1.55 B USD, despite the estimated figure of 1.59 B USD. In the next half-year revenue is expected to reach 1.49 B USD.
BKGFF net income for the last half-year is 234.88 M USD, while the previous report showed 248.36 M USD of net income which accounts for −5.43% change. Track more Berkeley Group Holdings Plc. financial stats to get the full picture.
Berkeley Group Holdings Plc. dividend yield was 0.79% in 2024, and payout ratio reached 8.87%. The year before the numbers were 1.40% and 17.65% correspondingly. See high-dividend stocks and find more opportunities for your portfolio.
As of Feb 14, 2026, the company has 2.55 K employees. See our rating of the largest employees — is Berkeley Group Holdings Plc. on this list?
EBITDA measures a company's operating performance, its growth signifies an improvement in the efficiency of a company. Berkeley Group Holdings Plc. EBITDA is 644.79 M USD, and current EBITDA margin is 20.27%. See more stats in Berkeley Group Holdings Plc. financial statements.
Like other stocks, BKGFF shares are traded on stock exchanges, e.g. Nasdaq, Nyse, Euronext, and the easiest way to buy them is through an online stock broker. To do this, you need to open an account and follow a broker's procedures, then start trading. You can trade Berkeley Group Holdings Plc. stock right from TradingView charts — choose your broker and connect to your account.
Investing in stocks requires a comprehensive research: you should carefully study all the available data, e.g. company's financials, related news, and its technical analysis. So Berkeley Group Holdings Plc. technincal analysis shows the sell today, and its 1 week rating is sell. Since market conditions are prone to changes, it's worth looking a bit further into the future — according to the 1 month rating Berkeley Group Holdings Plc. stock shows the sell signal. See more of Berkeley Group Holdings Plc. technicals for a more comprehensive analysis.
If you're still not sure, try looking for inspiration in our curated watchlists.
If you're still not sure, try looking for inspiration in our curated watchlists.