GER40 TRADE BUYING TRADE IDEA GER40 TRADE BUYING TRADE IDEA
The key buying level
Entry Point: 16765.17-16690.17
Stop Loss:16229.17
Take Profit: 17000.17
GER30 trade ideas

DAX Short setupDax looks so good for a short. I can clearly see a broke down of a weekly trendline on higher timeframe. On lower timeframe we can also see a break of a short-term trendline, short squeeze and drop. My indicators also shown a good divergence on h4 timeframe, and a drop is gihly expected
✅DAX BULLISH BREAKOUT|LONG🚀
✅DAX is trading in an
Uptrend and the index broke
The key horizontal level
Of 16,500 so I am bullish
Biased now and I think that
We will see a further move up
LONG🚀
✅Like and subscribe to never miss a new idea!✅

DAX Elliott Wave Analysis for Monday 18/12/2023 (+ HTF)In the higher time frame, it looks like we started a new upward cycle from the October low. This means the wave ((2)) low is in after an expanded flat. The alternative scenario assumes a wave (2) low of a lower degree. In the lower time frame, we are observing ending upward structures.

GER30 Buy Idea. Support level hit.
The price failed to break this support level to the downside. Doji candle formed by the support region, however, so I am pretty confident it will retrace upwards in the upcoming week.

DE 18-22 DECDay is still a strong trend for buy where we can look for sell on H4 or H1.
Day >> buy
H4, H1 sell to buy at Day zone

DE40 for 19-2 DEC 23DE40 for 19-2 DEC 23
Day is still a strong bull market where we can see the reversal in smaller time frame such as h1, h4 and m30 where we could find opportunity to sell. Happy trading everyone !!!
M30 H1 H4 > Sell
Day > Buy

DAX: Channel Up keeps it bullish. Strong correction if it breaksDAX is trading inside a Channel Up pattern since October 27th and it has been intact for so long that the 1D timeframe remains overbought (RSI = 78.050, MACD = 373.200, ADX = 82.264). Since it is holding the 4H MA50 over the bottom of the Channel Up, we remain bullish aiming at a +4.66% rise (TP = 17,400), which is the lowest it has registered inside this pattern. If the price crosses under the Channel Up however, we will short aiming near the S1 level (TP = 16,000), which can test the 1D MA50.
## If you like our free content follow our profile to get more daily ideas. ##
## Comments and likes are greatly appreciated. ##

Short Dax
- Bearish engulfing
- Selling climax
- RSI overbought
- MACD about to cross
- Looking for retrace towards 50 day EMA
- 3.44 RR

DAX40Note:
The Market Currently ranging on 1YR TM , Within the TM the are 3 Confirmation Observed:
1.9 Month 1-2 RTM =bullish Trend
2.2Months 1-2 RTM- Bullish Trend
Additionally: Pin Ball buy and ROC new Low =Bullish
3.Daily has First Close below the SMA
-This appears as Flag on 240 and 120 TM.
Entry: Look For 3 pushes on 5,15,30 Minutes Time Frames
This Confirmation are Visible on SP500, US100 and DOW.

ECB stopped the DAX rallyThe German DAX has been riding high (new all time highs) due to the expectations that the ECB (European Central Bank) would be providing some needed rate cuts in the near future to the ailing German economy and the Eurozone. The DAX, as a result, has rallied to all time highs in recent weeks. Following the ECB meeting the DAX is now seeing a technical bearish engulfing candle and looks poised to retest the breakout point at 16570. The ECB meeting was considered a "hawkish hold" as they try to temper expectations of a rate cut near term. In turn, the German DAX may fall as expectations of a rate cut are reduced.

short daxthe first time ive bothered shorting this rally.
i think its time, diverging from other indices and showing some good weakness.

DAX Elliott Wave Analysis for Friday 15/12/2023In the higher time frame, it looks like we started a new upward cycle from the October low. This means the wave ((2)) low is in after an expanded flat. The alternative scenario assumes a wave (2) low of a lower degree. In the lower time frame, we are observing ending upward structures.

DAX is Punishing Late BullsThe DAX experienced a near-perfect landing at 17,000 points during the opening, only to decline by approximately 360 points throughout the day. Many traders seized the opportunity presented by the "best signal in technical analysis," a new all-time high, to enter the market, only to be punished as anticipated.
The hammer candlestick on the H1 chart currently signals a rapid price increase. However, we advise exercising caution and draw attention to the liquidity zones on the downside.
We recommend waiting for the Liquidity Sweep of the first zone before initiating long positions, as this area presents an excellent risk-reward ratio (CRV).
The market should pivot strongly, at the latest by the second liquidity zone, assuming the new all-time highs are not a false breakout.

Dax Long SignalRSI Bullish Divergence, high volume day, i except price to go till 16975, what do you think?

Ger 40in daily timeframe is above 20 moving average, and in 4H time frame the price reached level 50% Fibonacci.
trade is long and first target at 17000.

DAX about to start its final leg up?What do we got here since the 2022 low? Right PA holding above 4.236 with actually already having triggered final target around 8.236.
Recent PA could be seen as a broadening wedge - typical for a wave 4 corrective pattern.
---
If you like my content, if it helps you gain profit, give it a like!
Thanks!
---
Hold my beer pls
----
No financial advice, do your own research, don't be stupid

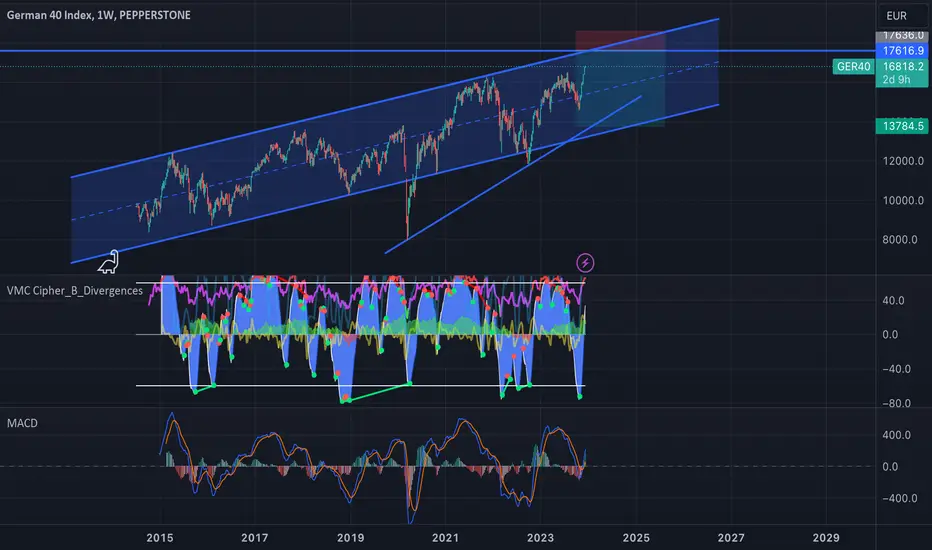
DAX Will the 1D Golden Cross pull it back like last time?DAX (DE40) is trading within a 16-month Channel Up and is currently on the second most aggressive bullish leg, about to form the 2nd 1D Golden Cross within that time span. The 1D RSI is above 85.00 touching historically overbought levels while the price is approaching the 1.382 Fibonacci extension from the previous Higher High of the Channel, which is below where the Channel's first bullish leg of October - November 2022 peaked and then, after a 1D Golden Cross formation, pulled back to its middle trend-line and the 1D MA50 (blue trend-line).
Despite those bearish indicators, we will sell only after the 1D MACD forms a Bearish Cross, which has been the most consistent sell signal throughout this period of time and target 16500 (Channel's middle). On the other hand, if the index breaks above the 1.382 Fib first, we will buy the break-out and target 18000, which is the top (Higher Highs trend-line) of the Channel Up and +24.20% rise from the bottom (similar to the November 2022 rally).
-------------------------------------------------------------------------------
** Please LIKE 👍, FOLLOW ✅, SHARE 🙌 and COMMENT ✍ if you enjoy this idea! Also share your ideas and charts in the comments section below! This is best way to keep it relevant, support us, keep the content here free and allow the idea to reach as many people as possible. **
-------------------------------------------------------------------------------
💸💸💸💸💸💸
👇 👇 👇 👇 👇 👇

Ger40 still room on weekly My target is 17600ish on the weekly then I’ll be shorting from there, we may hit some consolidation or possibly a slight move down first but ultimately I’m long till 17600 then I’m flipping, obviously with more analysis when we hit that target , any thoughts let’s hear them maybe I’m completely wrong .
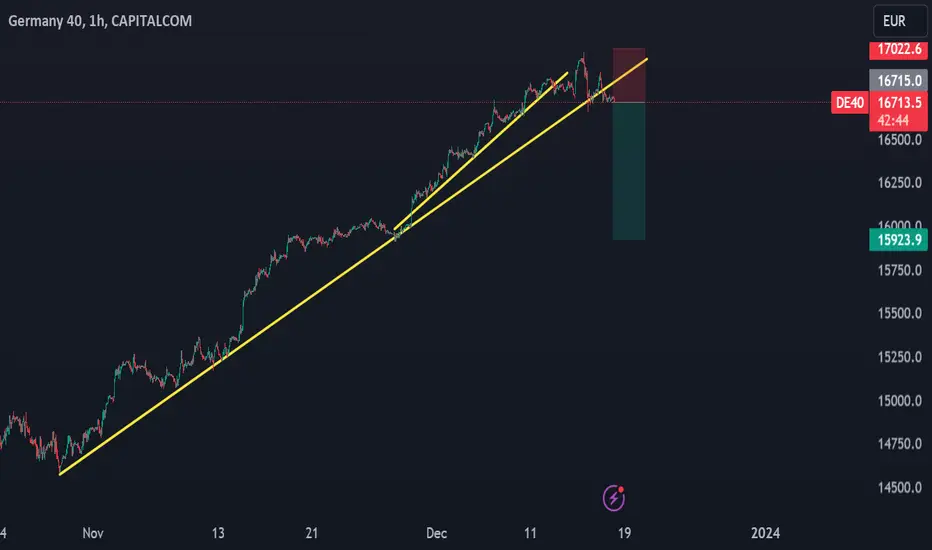
DAX Pay AttentionWe are ranging high with DAX, and watching on smaller timeframe we can see that short-term trendline got broken. Looking higher, 1HR TF has not been reclaimed yet. We can expect a test of this trendline, a broke, a retest and if all plays out a drop. Will keep updated

DAX Elliott Wave Analysis for Wednesday 13/12/2023In the higher time frame, it looks like we started a new upward cycle from the October low. This means the wave ((2)) low is in after an expanded flat. The alternative scenario assumes a wave (2) low of a lower degree. In the lower time frame, we are observing ending upward structures.

Shorty MortyMore than try can we not do,
Maybe or maybe not.
I haven't had a trade in a long time And the development seems very fitting to me for a short ter m short position

German Stocks Have a CCI Sell signalMy prior post illustrated how using CCI with RSI can signal market turns.
Currently the Germany 30 has a CCI bearish divergence with a very overbought RSI reading.
A down turn in this index could be happening soon!
