Bitcoin 1 000 000$ ❚ Livermore cylinder📣 Hello everyone!
I bring to your attention my, I’m not afraid of this word, GLOBAL trading idea for Bitcoin for the decade ahead!
☝️ Now let me, as briefly but informatively as possible, explain to you how, step by step, Bitcoin will most likely come to $1,000,000 dollars, as well as what the two most serious risk factors are today ⚡️
In 1929, Jesse Livermore published this hypothetical chart (bottom right) showing “The Most Important Thing Happening to the Price of A Stock.” At the beginning of this pattern there is an expanding accumulation wedge, an upward “megaphone” (“horn”) formed from two sloping trend support/resistance lines. In the original, according to Livermore, it is necessary to take into account the volume when forming a pattern, but in my opinion, in relation to Bitcoin, it is better to take into account the spread; I removed this turkey from the final chart for the aesthetic reasons of the trading idea, so let’s study it on our own.
Having spent quite a lot of time on multiple technical and fundamental analysis of BTC, as well as taking into account trends in the macroeconomics of the United States and the world economy as a whole, I came to the conclusion that a very strong bullish pattern is forming on the Bitcoin chart - the EXPANDING WEDGE OF LIVERMORE ACCUMULATION!
This means that from the birth of Bitcoin until 2024, all these bullish and bearish microcycles are a period of accumulation of the asset!
🔹 Now briefly on key points according to the pattern:
1️⃣ All-time Low (ATL) - the minimum price of Bitcoin in its entire history, the birth of an asset!
2️⃣ ATH 2017 – First serious takeoff 🚀 Maximum of the bullish rally that ended in 2017 in the 19-20 k$ zone
3️⃣ Low 2018 – minimum correction after ATN 2017
4️⃣ ATH 2021 – a new absolute historical maximum in the area of 69k$, which only a few spoke about in 2019, including me with my trading idea Bitcoin $55 k$
5️⃣ Correction completed - low 15.4 k$ - Correction to growth to $69,000 completed in November 2022
6️⃣ The end of the bullish rally 2022-2025 - Bitcoin price 115-150 k$
- According to the graphical pattern I am considering, the long-term upward trend will most likely be limited in growth, taking into account the error on the monthly frame, by the zone of 115 - 150 k$ - At the moment, Bitcoin is consolidating above 60 k$.
The second inflation wave will force the Fed to return to tightening monetary policy after the US elections, probably closer to the second half of 2025 or even by the end of this year! Bitcoin will set a new ATH before this time and a long-term bearish trend will begin.
7️⃣ In 2027 - low correction ≈ 30 k$, the Fed is forced to give up, the war against inflation is lost. The start of an unprecedented QE... FED Money printer - brrrrr.....
- In 2027, the Fed will be forced to surrender, the war against inflation is lost. The United States will solve all its problems in the only possible way - launching a printing press and unprecedented QE. 2027 marks the start of the dollar's descent into hyperinflation.
The Bitcoin correction will end at 30 k$ +-10%, this will be the last opportunity to buy before the bull market of the century, the realization of an exit from almost 20 years of accumulation!
8️⃣ The most powerful and fastest bull rally in history! The first wave after exiting
accumulation. Hyperinflation in the USA...
- The most powerful and fastest increase in the price of Bitcoin in history! The first wave of the bullrun after exiting accumulation, within 1-2 years the mark of 500 k$ per coin will be reached. The United States is plunging into hyperinflation, the dollar is leaving the world stage, and the yuan is taking its place. Digital assets and commodity markets are growing.
9️⃣ ATH is coming soon... The second wave of the bull rally!
- Soon there will be ATH in pairs with the dollar... The second wave of the bullish rally! Hyperinflation is growing, the Fed can do nothing more - the phrase “dollar collapse” will sparkle with new colors among skeptics.
1️⃣0️⃣ Bitcoin $1,000,000 + "Bubble Peak"
– Bitcoin has crossed the $1,000,000 mark, the peak of the dollar bubble. In 2030-2035, the dollar may cease to exist as a currency in general; trading against the dollar may simply be stopped.
The value of BTC will already be measured, for example, against gold in the BTC/GOLD pair, or the Chinese yuan BTC/CNY.
_____________________________________
⚠️ This could have been the end, so to speak, to put an end to this trading idea. Further points make sense only if the dollar still exists, which is unlikely from my point of view. I just don't know what should happen. But I still outlined further points on the original Livermore pattern in this trading idea.
________________________________________
1️⃣1️⃣ BTC first major sale
– the first major sale of Bitcoin, since there is no such thing as eternal growth! Sooner or later there will always be people willing to sell; former bulls begin to sell short!
1️⃣2️⃣ Test 1 000 000$ before selling short!
– A round psychological level of one million dollars will be like the 10 k$ level for Bitcoin at one time; the price will interact with it more than once. 1 000 000$ test, followed by a powerful dump.
1️⃣3️⃣ Long-term correction near strong support 500 k$,1M timeframe
- Long-term correction - strong support 500 k$, timeframe 1 month.
1️⃣4️⃣ Flat correction – Another flat correction in a bear market, or any other.
1️⃣5️⃣ Strong support 100 k$ - Strong support in the area of 100 k$ - the formation of the bottom before a new growth cycle, it will probably already be >10 000 000$ (assuming the dollar exists at all!)
🔹 I note two global risk factors that could make significant adjustments to this global trading idea:
1️⃣ This is the government's fight against Bitcoin. I believe that in 2025-2027 Bitcoin will come under pressure from the US government, when it is already clear that Bitcoin poses a real threat to the dollar. Ultimately, Bitcoin will emerge victorious from this situation and there will be growth. The main trigger for the future bear market phase from my point of view!
2️⃣ The second threat is more significant. Bitcoin depends on electricity and miners in particular. Planet Earth is entering a cycle of natural disasters that will increase exponentially every year. Many areas in the world will become uninhabitable. Sooner or later, large miners will come under attack, what geolocations they will be and who will suffer first - I don’t know for sure! The network may not die completely, provided that the life of humanity and technology on Earth is preserved. But it is impossible to predict what damage will happen to the price of Bitcoin in this case.
⚠️ That's all for today, I wish you good luck in making independent trading decisions and profit. Please analyze the information received from me, always think only with your own head!
Goodbye! ✊
Trade ideas

Is it really possible for Bitcoin to reach 1 million dollars?Is it really possible for Bitcoin to reach one million dollars?
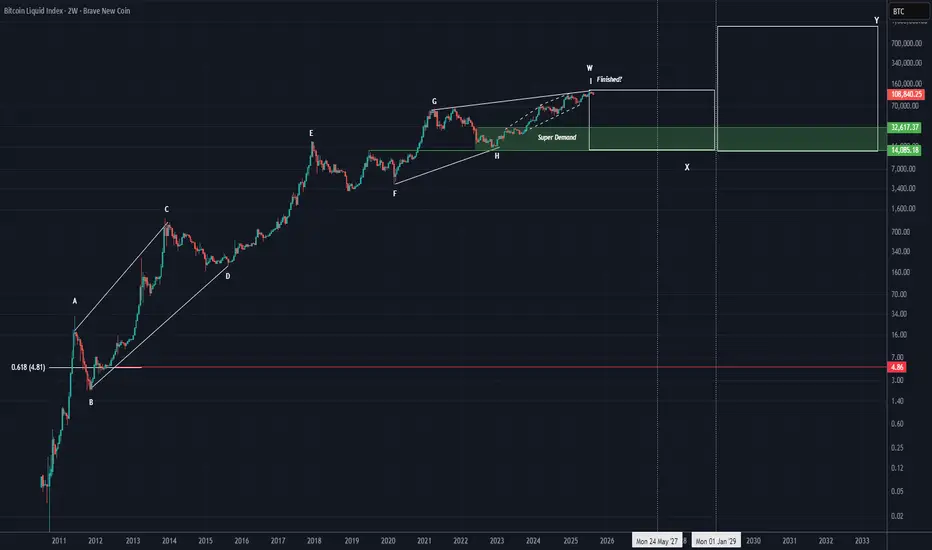
This is the complete Bitcoin data | from when it was $0.01 up to the last all-time high of $125K. Whether we like it or not, a large-degree pattern on Bitcoin is reaching completion, and we are looking at the chart without bias, purely through wave theory.
The symmetrical pattern you see on the chart is on the monthly or 2-week timeframe.
We are currently in the final wave, wave i of W. Wave i of W itself is a diagonal or symmetrical pattern (which we discussed in THIS POST () |this post only concerns branch i of W of this pattern).
When such a large pattern completes, there are two possibilities:
A counter cycle of the same degree begins , or
An X wave forms.
First scenario: forming a new pattern is very unlikely because if it happens, the Fibonacci 0.618 target of this pattern would be reached | around $4–$10 for Bitcoin. If this happens, the entire crypto market would effectively become a scam. This scenario is highly improbable and currently illogical.
Second scenario: the formation of an X wave. It’s worth explaining X waves: X waves connect patterns of the same degree without requiring large time-price corrections relative to the previous pattern, allowing a phase | whether bullish or bearish | to extend. Here, since the first phase is bullish, the pattern after the X wave will also be bullish.
For Bitcoin, if an X wave forms, the best range for it to end is $32K–$14K, and the X wave could last until 2027–2028. The two time lines indicate where the X wave could end.
When a new cycle begins, it is of the same degree as the previous pattern. This means we will have years of bullish phases with corrections, similar to the first phase W, which is represented on the chart from wave A to I.
The target of the second pattern, Y, after the X wave, can realistically reach $1 million! The estimated time frame for reaching this target is 2031–2039, but why the 8-year tolerance? This accounts for the pattern type: if it’s a triangle, these targets could be reached faster, but if it’s another multi-branch pattern, the timing may extend.
From a technical and wave-theory perspective, this is indeed possible. This is our broad 10-year outlook on Bitcoin.
❤️ Stay with us updates will be provided in the future with support and resistance zones plotted on the chart. Do you really think Bitcoin can reach $1 million?
BRAVE NEW COIN TOP (EXPERIMENTAL)BNC:BLX
It's important to note that cryptocurrency markets are highly volatile, and such forecasts are speculative. Investors should conduct thorough research and consider their risk tolerance before making investment decisions.

Bitcoin / #Russell2000 📝The index of small companies is known for being highly dependent on bank financing. Therefore, of course, he is the main beneficiary of cheaper money after the rate cut.
👀What we see about correlations, CRYPTOCAP:BTC bull markets, coincide with the movement of this index as you can see, in the green zone on the Spearman indicator,
💡We can also see that Russell 2000 is far from its ATH, which is also a bullish sign, because small companies in the stock market grow quite predictably with GDP growth and increased liquidity, and in the current state is far from overheated.

Bitcoin: The End of the Bull Cycle 1. Introduction
For more than a decade, Bitcoin has followed a consistent cyclical pattern that repeats after every halving.
On my long-term chart, which I’ve been tracking since previous cycles, the pattern is clearly visible:
Halving → Bull Market → Bear Market → Accumulation
2. Where We Are Now
Bitcoin is currently nearing the end of the 2024–2025 bull market.
We can already observe:
Prices have reached new all-time highs
The psychological “euphoria” phase is behind us
Volumes are declining
Market sentiment is cooling down
These are classic signals of a transition into a prolonged bear trend, which historically lasts 12–18 months after the peak.
3. Bitcoin’s Cyclic Nature
Each halving event introduces new supply scarcity— but the market’s reaction is delayed by 6–12 months.
After the 2012 halving peak came a year later
After the 2016 halving top in December 2017
After the 2020 halving top in November 2021
After the 2024 halving expected peak in 2025, which is unfolding now
What follows is usually a sharp correction, a cleansing phase, and then renewed accumulation.
4. What to Expect Next
If the pattern holds, 2026 could mark the start of another “crypto winter.”
During that time:
Large institutions accumulate quietly
Weak hands leave the market
Altcoins face heavy revaluation
A new foundation forms for the next bull cycle — expected before the 2028 halving
5. Conclusion
My chart reflects more than price it’s a map of emotions, fear, and greed.
Now is the time for strategic thinking, not panic or FOMO.
Those who preserve capital and discipline through the downturn
→ will become the leaders of the next cycle.
“Surviving the bear market is how you earn the right to lead the next bull one.”

BTC Cycle Review: know when to hold 'em & when to fold 'emReviewing the time around the halving that produces profitable trending signals.
From the chart 1 yr and 2 months before the halving and 1 year 5 months after the halving produces profitable signals
consider pre halving to be spring
consider post halving to be summer
consider the red X between the two to be winter and unprofitable to take signals.
Posting this up as reference into the next cycle. interested to see how this plays out.

Bitcoin Keltner Channels 📈BTC Keltner Channels
🔝Bitcoin broke out of the baseline resistance, under which it consolidated for a long period.
✍️While I don't expect a return below this gray line until the peak of the cycle, remember that it is almost 2 years away and we will have more than one correction before then.
💡I expect especially volatility in the next six months when there are quite a lot of events related to BTC.

Bull Or Bust?Having this count as a potential forecast for the continuation of the existing trend - cycle top should come in late next year if this is correct - the biggest question is if wave 1-2 is the actual count...but we will know eventually.

Bitcoin: Redux ITargets listed for cycle tops.
30-40k expected bottom before continuation to 200k levels.
Halving April 2024.

Begining of the bear marketThe bear market will start in early November and last until December 2026, with a target of 70,000 dollars per Bitcoin.

BTC 2017 All Over Again? Is It About to Go Parabolic?Forbes just ran with a headline about a Bitcoin “death spiral.” The wording might be sensational, but the risk they are pointing to is real. It is sitting inside Bitcoin treasuries.
Companies like MicroStrategy (NASDAQ:MSTR) and Nakamoto are being packaged as safe institutional gateways to Bitcoin. The truth is, they are not just buying and holding. They are borrowing, issuing debt, and selling shares to continue buying more BTC. That structure works brilliantly when the price is running higher. When BTC pulls back, the debt remains while the value of the collateral falls. If their share prices sink at the same time, they cannot raise fresh equity. That is when forced selling begins, and the pressure feeds on itself.
This is where the LUNA comparison fits. LUNA collapsed because the system relied on TWAP buying to keep its peg alive. It needed a constant programmed demand. The second confidence cracked that demand disappeared, the mechanism broke, and the whole structure fell into a reflexive death spiral. Bitcoin treasuries carry a similar fragility.
They look strong on the way up because debt and dilution keep the system fed. But if one cracks, others will likely follow, and the forced selling could cascade through the market. It is history repeating in a new form.
The Cycle Overlap
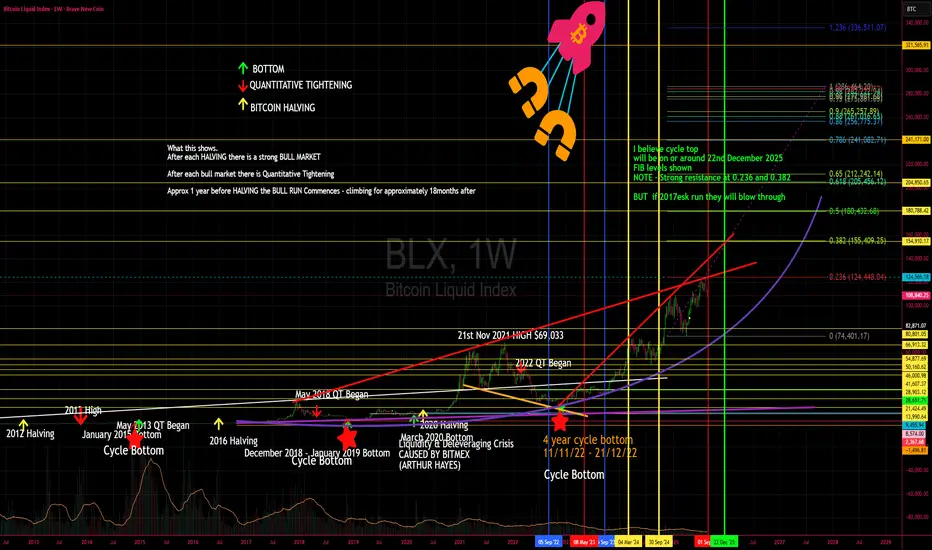
Now layer in the cycles. December 2024 marked the rollover of the 8-year stress cycle in traditional markets. That signal has already triggered. But treasuries are not following that rhythm. They are moving in line with Bitcoin’s 4-year cycle. Every halving is followed by a strong run, a cycle top, and then a correction. That puts the real pressure point into December 2025. If treasuries hit the wall at the same time Bitcoin’s bull cycle peaks, the overlap could accelerate a blow-off followed by a brutal correction.
The 8-Year Stress Cycle (Traditional Markets)
2000 → Dot-com bubble rollover. Fed started cutting rates, but equities crashed hard into 2001–2002.
2008 → Global Financial Crisis. Fed slashed rates aggressively, but markets fell into a full-blown meltdown before recovery. 2009 was the brutal washout before recovery.
2016 → Global growth scare, China devaluation, Fed hiking cycle wobble. Markets pulled back, stress showed, then liquidity stepped in.
2024 → December rollover. The signal of cracks returning: inflation sticky, rate cuts being prepped, credit stress building, and leveraged players under pressure.
The pattern - every 8 years, traditional markets hit a rollover point where stress shows up, liquidity shifts, and the system resets.
The 4-Year Bitcoin Cycle
2013 → Top after 2012 halving, deep correction.
2017 → Top after 2016 halving, brutal correction in 2018.
2021 → Top after 2020 halving, correction in 2022.
2025 → Halving cycle points to a top window in December 2025, with correction risk into 2026.
Where Tether Fits
Tether (CRYPTOCAP:USDT) is not just minting stablecoins. It has become one of the largest buyers of short-dated US Treasuries on the planet, with more than 120 billion US dollars worth on its books.
In calm conditions, that makes sense, they clip yield and backstop redemptions. But if markets crash and liquidity dries up, redemptions spike. To meet them, Tether must raise dollars by selling or repo’ing those T-bills. Normally, that is seamless. In stress, selling can add to liquidity drains at the edges of both the Treasury market and crypto. If redemptions surge at the same time treasuries are being forced to sell BTC, you get a double liquidity squeeze.
The Technical Picture
Look at the Fibonacci structure on the chart. The key levels line up with what could be a wave 3 of 3 in Elliott Wave terms — the most explosive part of any trend. That explains the sharp upside move this year. It is powerful, but it is also the phase where leverage and euphoria get stretched the furthest. If this lines up with treasuries cracking and Tether redemptions spiking, the volatility on both sides will be extreme.
2016–2017 vs 2024–2025
In 2016, traditional markets were rattled by China’s devaluation, an oil price collapse, and Fed policy missteps. Liquidity reset the system. For Bitcoin, that reset coincided with the halving and set up the most explosive run in its history. By 2017, equities were making new ATHs and Bitcoin went parabolic to nearly $20k before the brutal 2018 correction.
Now in 2025 we are seeing the same setup. Stress triggered in December 2024, but liquidity is flowing back. Markets everywhere are hitting new ATHs. Bitcoin has surged and is acting like it is in its 2017 phase right now, the blow-off leg of the 4-year cycle.
That puts the risk squarely into December 2025 for a cycle top followed by a correction.
The Cycle Top Target
I believe the cycle top for Bitcoin will land on or around 22nd December 2025.
The Fibonacci levels line up cleanly with this window:
Strong resistance at 0.236 and 0.382.
Under normal conditions, these zones would cap the move, but if we are truly in a 2017-style run, price can blow straight through them in a parabolic surge before the eventual correction. Fibs left on the chart for reference.
Key points
BTC treasuries are leveraged and debt-loaded.
Many treasuries exist, not just one, so cascades are possible.
December 2024 = 8-year rollover in traditional markets.
December 2025 = 4-year BTC cycle top window.
Tether can flip from stabiliser to amplifier if redemptions rise.
Fibonacci shows a potential wave 3 of 3, explosive but unsustainable.
2025 mirrors 2017: markets at ATHs, Bitcoin in parabolic mode.
Target: 22nd December 2025 as the likely top.
Stop losses and capital protection are critical.
It looks like BTC 2017 all over again.
The parabolic phase may not be finished yet, but the closer we get to December 2025, the sharper the risk of a brutal correction. This is not Bitcoin dying. This is a test of leverage and liquidity. If treasuries and Tether both get squeezed into the cycle top, the correction could be brutal. But as always, it will clear the field for the next 4-year cycle if you survive the next brutal 2026 BEAR Market.
Thanks for Reading, and please let me know your thoughts
<3 Lisa
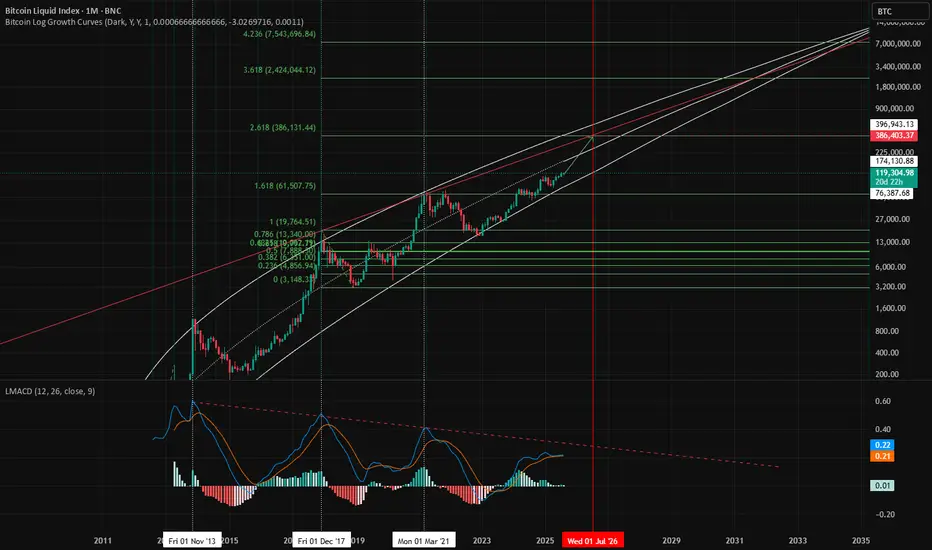
BTC logaritmic regresion analysisThe red lines mark the hypothetical range of maximum for this cycle.
Until now, BTC has been behaving just as expected. The green box should mark the way up.
The gray zones represent the premium and the discount regions. Up and down respectively.
Follow your own plan. Greed and fear are never good advisors.
This is just an opinion, not an advice of any kind.
Market is the only master of its actions.

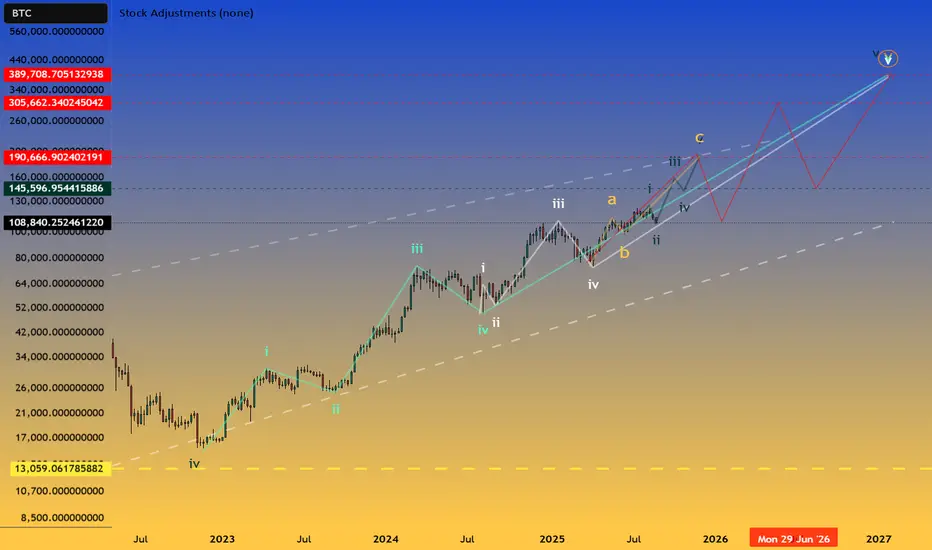
Bitcoin's Incredible Potential for a $400,000+ Price TagBINANCE:BTCUSD Bitcoin looks to remain the talk of the financial world as it prepares for a strong upside stretch to $191K by end of year 2025. Though we may see a prolonged pause near the $150K-$160K rage, it will likely only serve to trap bears and allow profitable entry for new buyers. My macro outlook on Bitcoin remains as bearish as it could ever be, but until November 2026 - March 2027, I think that it will continue to move up by small margins (especially when compared to memes/alts like UNISWAP:TSUKAUSDC_67CEA3 ). Some of the most renown experts have end of cycle targets like $1,000,000+. I think this is the most farfetched news you could be fed right now.
Protect peace.
Protect purpose.
Protect profits.
BITCOIN - The Corrective Pattern Since 2013 Explained...In this video, I break down Bitcoin’s corrective pattern since 2013 using the AriasWave methodology—rather than Elliott Wave or Bollinger Bands. This marks a significant moment for AriasWave followers, as I apply the method in a more advanced way to decode not only Bitcoin’s structure, but also global markets and, most importantly, Altcoins.
I highlight Altcoins in particular because they appear to hold the greatest potential for explosive growth, largely due to their lagging correlation with Bitcoin. This video is the first in a new analysis series, where I’ll soon take a closer look at Bitcoin’s short-term price action. For now, I wanted to start with this broader perspective, which projects Bitcoin reaching a target range between $276K and $311K.
The target for Ethereum is $69K.
I will explain the target for Thor Chain in an upcoming RUNEUSDT video.

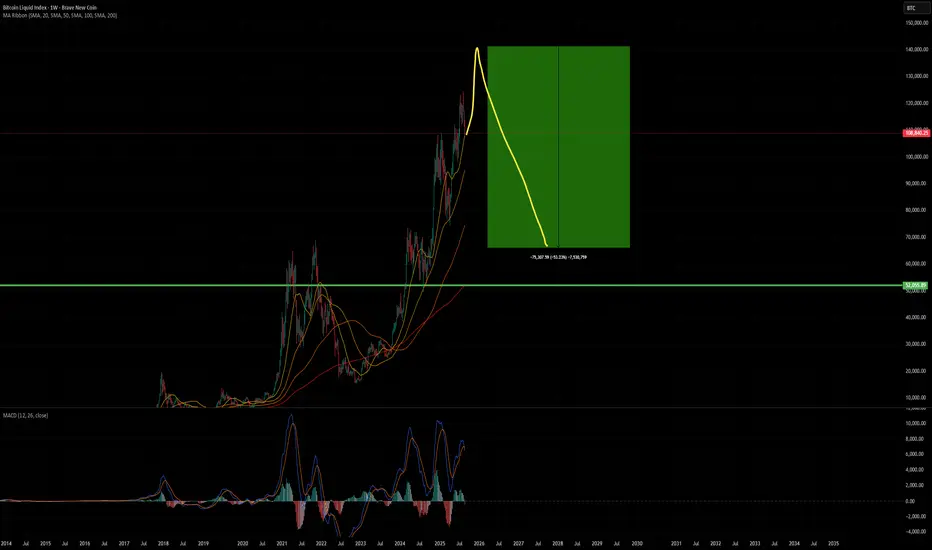
BTC USD last push before correctionThe indicators are slowly showing that the market is running out of steam and Bitcoin needs a breather. In terms of cycle timing, we're also slowly approaching the final stages.
Retail interest is showing increasing interest, which is also slowly signaling the top.
In my opinion, we'll see a final push and then slowly enter the bear market.
The top could be somewhere between 130,000 and 140,000, which would then initiate the correction.
Be careful.
BITCOIN - Just Some Talk Before I Get Serious...I’m not here to sugarcoat your reasons for investing in crypto. My role is simply to share the insights I see in this market, whether you like them or not. Honestly, part of me hopes people lose money—not because I think about it every day, but because maybe then they’ll finally wake up to what they’re really doing with their money.
From a bigger-picture perspective, I believe we’re on the edge of a major economic reset. The system can’t keep repeating the same cycles without breaking down. Eventually, reality catches up—and when it does, the economy will collapse in on itself, at least for a time. Do I care about that collapse personally? Not really.
What I do care about is AriasWave analysis—the methodology I developed over many years. And through that lens, the current market looks just like Tulip Mania or the dot-com bubble: frothy, unsustainable, and honestly, kind of hilarious. I can already see how it ends. Whether or not I “hope” for it, the patterns themselves point to an inevitable outcome.
If you can’t see this based on the analysis I’m showing you, then you’re willfully blind. Blind as a bat. And in markets, blindness costs money—you will lose.
Here’s the bottom line: based on AriasWave, I expect Bitcoin to peak somewhere between $276,000 and $311,000 before topping out. If you want to understand what comes next, you’d better follow along. Because if you don’t, you’ll stay blind to what’s really happening in the broader market—and in that case, survival is not on your side.
And by the way, there is more to come.

Gann Fann BTCJust thought this was interesting on how things lined up using a Gann Fann. I don't use this for trading, but... Interested to see how this plays out going forward

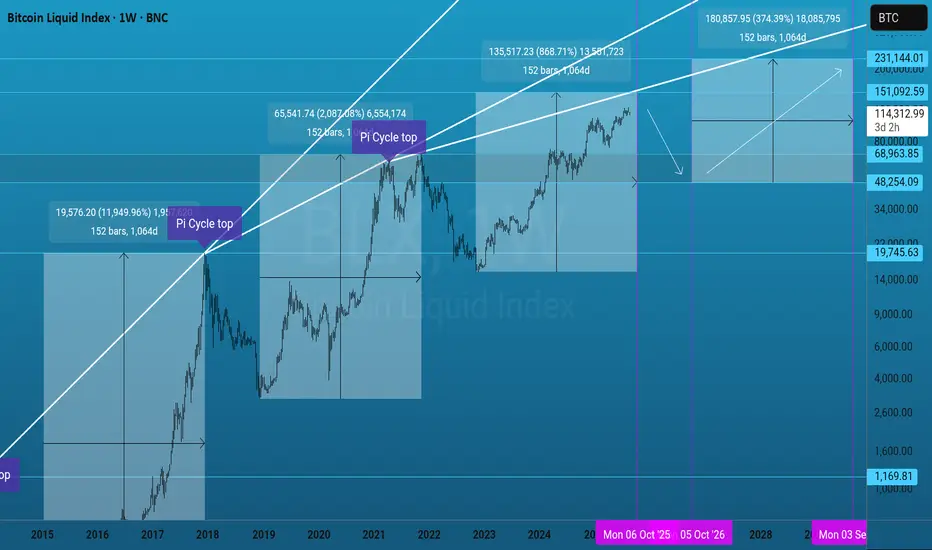
Current BTC cycle is almost over...We are currently waiting for the cycle to be over here. I believe we have about only a few more weeks left until we know what's going to happen. I expect the PI cycle top to show up sometime before October 6th. Then after that we will have about a year of bear to the 48 to 60k range. That should be the cycle low before the next 3 years push to 200k+ in 2029.

Math is Not Magic - BTCUSD Price Prediction 2026Looks like this pump will be extended. Using fibs on time and price, 380K is my target, timeframe is between March thru June of 2026. Watch for alts afterwards for rotation.
Good luck.
Btc Daily AnalysisBTCUSD just completed a 3 wave (b) correction to the downtrend from what I can see, expect further downward pressure. Watch for a target of around <$100k for the next leg down

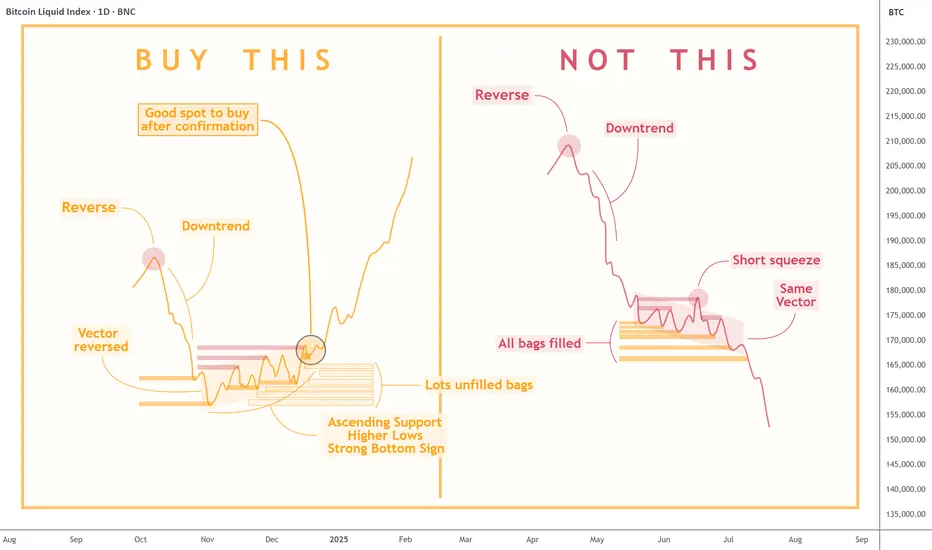
Quick Lesson: How to Identify Trend ReversalKnowing when to enter the market can mean the difference between making a profit and incurring a loss. The chart above clearly compares two similar-looking scenarios with very different outcomes: the one you should aim for and the one you should avoid.
- On the left , we see a textbook example of a bullish reversal. After a significant downtrend, the market prints higher lows and begins forming an ascending support. This signals that selling pressure is fading and buyers are stepping in. Notably, there are usually lots of unfilled bags — latecomers who show strong demand below the current price level but never get their orders filled, and who then just hit the 'market buy' button, which adds fuel to the fire of pump.
- In contrast, the right side shows a very similar pattern — a downtrend followed by consolidation, but with crucial differences. Here, all prior liquidity zones have already been filled, meaning there is less incentive for buyers to support the price. The “same vector” suggests price action hasn’t changed direction, and a common short squeeze traps late buyers before resuming the decline. This is a common bull trap , where a temporary price pump gives false hope before another leg down.
To sum up , a REAL REVERSAL builds on structure, accumulation, and higher lows—whereas a FALSE BOTTOM is often characterized by brief rallies, exhausted liquidity, and no change in vector trend. Experienced traders wait for confirmation and accumulation before entering a position, not just a temporary pause in a downtrend.
Long term Bitcoin view: the path to $100kI think Bitcoin will make a correction in the short run. The next target price can be $42k.
However I predict further gains in price in the mid run. The target of $100k may be achieved then. Though it is a far stretched number, I still expect a price move to that level.
If fail, we can expect a complex correction for the next 2-3 years. Final long term target will be above $100k.
#BTCUSDTP
