AAPL Short
Top of Bollinger Bands
Over bought on RSI
Completing Time Count on Weekly
Near top of Megaphone
AAPL34 trade ideas

AAPL STOCK BULLISH RUN CONTINUATIONThe stock of APPLE seems to continue it's Bullish Run as the Bullish Flag Pattern is formed and the breakout is also seen on the charts......
Manage your Risk Reward Ratio Accordingly....

Apple (AAPL) Looking to Complete Impulsive RallyCycle from 10.27.2023 low in Apple (AAPL) remains in progress as a 5 waves impulse Elliott Wave structure. Up from 10.27.2023 low, wave (1) ended at 181.9 and pullback in wave (2) ended at 169.33. The stock then rallies again in wave (3) towards 192.93. Pullback in wave (4) ended at 187.45 as a double three Elliott Wave structure. Down from wave (3), wave ((a)) ended at 190.82, wave ((b)) ended at 191.70, and wave ((c)) lower ended at 188.90. This completed wave W. Rally in wave X ended at 192.09 as a zigzag structure. Up from wave X, wave ((a)) ended at 191.08, wave ((b)) ended at 189, and wave ((c)) ended at 192.09.
Down from wave X, wave ((w)) ended at 188.19, wave ((x)) ended at 191.56, and wave ((y)) ended at 187.45. This completed wave Y of (4). The stock has turned higher in wave (5). Up from wave (4), wave 1 ended at 189.66 and pullback in wave 2 ended at 188. Stock rallies again in wave 3 towards 194.76. Pullback in wave 4 is now in progress to correct cycle from 12.5.2023 low in 3, 7, or 11 swing before it resumes higher. Near term, as far as pivot at 187.45 low stays intact, expect dips to find support in 3, 7, 11 swing for further upside to complete the impulsive structure from 10.27.2023 low.

Know Sure Thing: Navigating Trends and Volatility EffectivelyIn the realm of technical analysis, the Know Sure Thing (KST) indicator stands out as a robust tool for traders seeking to decipher market trends and manage volatility effectively. This momentum-based oscillator amalgamates multiple moving averages to offer a comprehensive perspective on market momentum across various timeframes.
Introduction to the Know Sure Thing (KST) Indicator
The Know Sure Thing (KST) indicator is designed to unveil the market's underlying momentum, encompassing both short and long-term trends. The KST is a dynamic momentum oscillator rooted in the Rate of Change (ROC) principle. It amalgamates four distinct ROC timeframes, smoothing them via Simple Moving Averages. Consequently, the KST generates a fluctuating final value, oscillating above and below a Zero Line. Additionally, it incorporates a signal line, derived from an SMA of the KST line itself.
The moving average methodology of KST empowers traders with a tool capable of identifying both bullish and bearish trends, providing an encompassing view of market momentum shifts. Fundamentally, this indicator gauges momentum using the ROC across four price periods, aiding analysts in detecting divergences, overbought or oversold market conditions, and crossovers.
Understanding Trends with KST
The KST indicator is predominantly used to discern the strength and direction of market trends. When the KST line crosses above its signal line, it signifies a bullish trend shift, indicating a potential upward price movement. Conversely, when the KST line dips below the signal line, it suggests a bearish trend shift, signaling a potential downward price movement.
Similar to the MACD, when a crossover happens and the KST line crosses over the zero the overall signal can be considered to have a greater degree of confirmation.
Moreover, traders rely on crossovers and divergences within the KST indicator for confirming trend reversals or continuations. Bullish and bearish divergences between KST and price action can provide valuable insights into potential market movements, offering opportunities for traders to enter or exit positions.
Managing Volatility Using KST
Beyond trend identification, KST also assists in measuring market volatility. It enables traders to gauge the degree of volatility present in the market at any given time. Sharp spikes or fluctuations in KST readings often coincide with periods of increased market volatility. This information is crucial for traders as it aids in adapting their strategies to accommodate varying market conditions, thereby managing risk more effectively.
Practical Applications of KST
A practical application of KST involves combining its signals with other technical indicators, such as Moving Average Convergence Divergence (MACD) or Relative Strength Index (RSI), to strengthen trade setups. For instance, if KST indicates a bullish crossover and MACD confirms the same, it enhances the confidence of a potential uptrend.
Additionally, traders use KST to identify bullish or bearish signals in conjunction with chart patterns. A bullish KST crossover alongside a bullish chart pattern like a "falling wedge" could reinforce the conviction for a long position.
Tips for Effective Utilization:
Effective utilization of the KST indicator requires a clear understanding of its strengths and limitations. Traders should consider experimenting with different settings and timeframes to find the optimal configuration that aligns with their trading strategies. Always implement some form of backtesting or paper trading to confirm that your strategy is in fact profitable.
The strengths of the KST indicator lies in its ability to offer a more complete view of market momentum. However, like any technical indicator, KST has limitations. During choppy or ranging markets, it might generate false or contradictory signals, leading to potentially misguided trading decisions. Traders should exercise caution and supplement KST readings with additional forms of analysis to mitigate the impact of its limitations.
It's paramount not to rely solely on a single indicator like the KST, but to corroborate KST signals with signals from other indicators or methods of analysis. A fortified approach involving multiple confirmatory signals, fundamental analysis, and risk management strategies strengthens trading decisions and minimizes potential false signals from any single indicator.
Conclusion:
The journey to mastering the Know Sure Thing (KST) indicator involves continuous learning, experimentation with settings, and adapting to evolving market conditions. By staying adaptable, open to new strategies, and consistently refining trading methodologies, traders can harness the full potential of the KST to navigate trends and volatility effectively.
In summary, the KST serves as a valuable addition to traders' toolkits, empowering them to make better trading decisions. Remember, while the KST enhances market analysis, prudent risk management and a comprehensive trading approach remain pivotal for sustained success in the dynamic world of financial markets. Good luck and happy trading!

Bull Pennant AAPL Target 199Bull Pennant on 5 min Clear As Day...
195C
12/15 @ 1.67
1/19 @ 4.45
PAMP IT - Bog

AAPL: Charts will not lie.Breaking the channel and flowing down, it looks amazing.
May be hit the resistance below and fill the above gap.
Let's see AAPL been very strong.

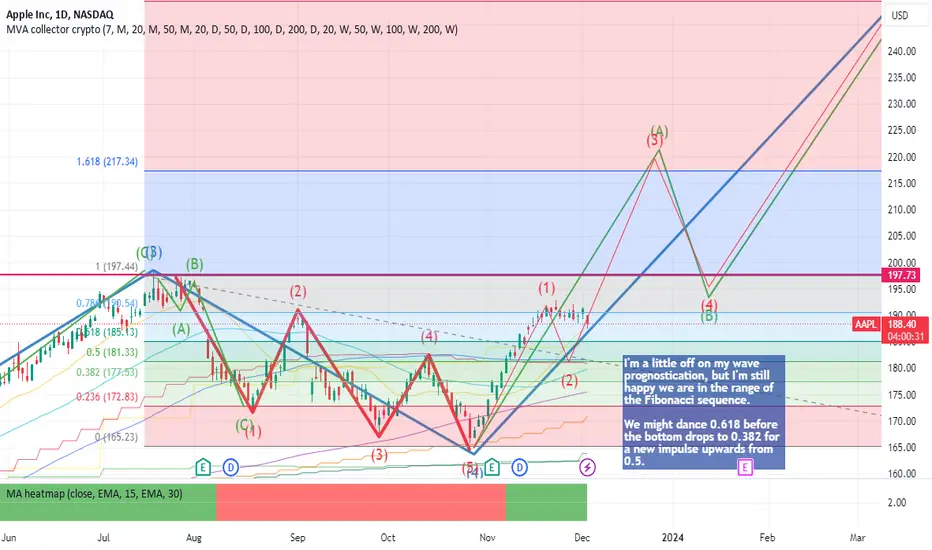
AAPL dancing on the fibs, are we going to see an impulse?I'm a little off on my wave prognostication, but I'm still happy we are in the range of the Fibonacci sequence.
We might dance 0.618 before the bottom drops to 0.382 for a new impulse upwards from 0.5.
I expect to stretch my wave projections out a few more weeks if the dance doesn't break up by midday-Tuesday.
AAPL - Minor Low BuyAAPL is in a strong trend and forming a bullish flag.
I entered 12/1/23 on the minor low breakout at 190.55. I should have bought less time on the option, because it prices quickly moved to my 161.8% target. I'm allowing it some room to run and will set another profit target. Currently, my trade is at breakeven stop loss, based on hitting the first Profit Target.
Title Minor Low Buy
Trade Theme Daily
Sector/Stock AAPL
Trend G/G
Propulsion Yes
Vscore Yes
Vprofile Yes
RAF Extreme
Darvas No
Darvas 3.0 Yes
Entry 190.55
Profit/Breakeven 191.65
Stop Loss 25%%
Option Option Play
19Jan24 190 Call

APPLE My Opinion! SELL!
My dear friends,
My technical analysis for APPLE is below:
The market is trading on 191.24 pivot level.
Bias - Bearish
Technical Indicators: Both Super Trend & Pivot HL indicate a highly probable Bearish continuation.
Target - 187.18
About Used Indicators:
A pivot point is a technical analysis indicator, or calculations, used to determine the overall trend of the market over different time frames.
———————————
WISH YOU ALL LUCK

AppleAs the trend continues to the supply area, it will be very important and fall
Correction up to area 184
And continue the upward path to $213

AAPL Weekly Harmonic Elliott Wave and Hurst's Cyclic AnalysisReview:
Let's review the key points of the previous update (Nov 21st):
Completed wave (I) of a of 3.
Expecting wave II, a shallow retracement.
October 26th was the first 40W trough of the current 80W cycle.
40D cycle trough on November 27th.
80D cycle trough on the first week of January.
20W trough in the middle of March.
40W FLD target is 215.
40W trough expected in June-July 2024.
Update:
Analysis of the Structure:
What I am doing in this update is going back to the count of September 9th. I think we are in wave a of 5 of (A) of 3. Looking into the hourly chart, we are in wave (V) of a. My target for the peak of wave a is 202.01.
Analysis of the Cycles:
There is not much to add to the cyclic analysis of the previous update. We are in the second 40D cycle of the current 80D cycle. The 80D cycle trough is expected on January 4th 2024.

capture channel breakoutsThe strategy() function is used to initialize the strategy with the name "ChannelBreakOutStrategy" and overlay=true to display it on the price chart.
The length variable is defined using the input.int() function. Traders can input the length of the channel they want to capture breakouts from. It accepts integer values between 1 and 1000, with a default value of 5.
The upBound variable is calculated using the highest() function from the ta (Technical Analysis) module. It finds the highest high price within the specified length period.
The downBound variable is calculated using the lowest() function from the ta module. It finds the lowest low price within the specified length period.
The if statement checks if the current bar's close price is not null (not na(close )). This ensures that the breakout calculation is only performed when there is enough historical data.
Inside the if statement, the strategy.entry() function is used to execute trades based on the breakouts. There are two entry conditions:
Long entry: strategy.entry("ChBrkLE", strategy.long, stop=upBound + syminfo.mintick, comment="ChBrkLE"). It enters a long position when the price crosses above the upBound of the channel.
Short entry: strategy.entry("ChBrkSE", strategy.short, stop=downBound - syminfo.mintick, comment="ChBrkSE"). It enters a short position when the price crosses below the downBound of the channel.


AAPL Long - Bullish Flag formingApple is forming a bullish flag on a daily chart.
It can fall down to 189.00 before a strong up movement.
Plan: wait for opening print and first 5 minutes candle to develop. Enter long only after a pullback (also on a 2min chart), TP 190.89, 192.02, 193.00

AAPL: risky but worth a long?A price action above 190 supports a bullish trend direction.
Increase long exposure for a break above 194.00.
The target price is set at 208.
The stop-loss price is set at 183.00.
Remains above its 200-day simple moving average.
Remains a risky trade as the stock is closely testing the July high prices.

Apple attracts Android users to iOS. Stocks may growApple Inc. announced changes to its messaging software in 2024, aiming to facilitate integration between iOS and Android. The Rich Communication Services protocol, supported by the GSM Association, is in the implementation plans. The indirect purpose of such innovation is to encourage Android users to switch to the iOS operating system.
So today, we suggest looking at the Apple Inc (NASDAQ: AAPL) stock chart.
On the D1 timeframe, support formed at 188.57, and resistance moved to 191.91. If quotes consolidate above 190.96, it may signal a continuation of the upward trend.
On the H1 timeframe, in the event of a breakthrough of the 190.96 level, the target for a price increase can be set at 196.66. In the medium term, the price could potentially reach 205.55.
—
Ideas and other content presented on this page should not be considered as guidance for trading or an investment advice. RoboMarkets bears no responsibility for trading results based on trading opinions described in these analytical reviews.
The material presented and the information contained herein is for information purposes only and in no way should be considered as the provision of investment advice for the purposes of Investment Firms Law L. 87(I)/2017 of the Republic of Cyprus or any other form of personal advice or recommendation, which relates to certain types of transactions with certain types of financial instruments.
Risk Warning: CFDs are complex instruments and come with a high risk of losing money rapidly due to leverage. 67.85% of retail investor accounts lose money when trading CFDs with this provider. You should consider whether you understand how CFDs work and whether you can afford to take the high risk of losing your money.


AAPL 4hr with trends and volume support zonesAAPL 4hr with trends and volume support zones
I prefer the volume based support and resistance zones because they provide more accuracy

AAPL: Last week of November Levels to watch.
The chart isn't bearish, imo.
Top of the range next week is 195, bottom is 184.
A tad on the over-extended side but that hasn't seemed to matter for quite some time.
Play what's in front of you, not what you think.
Best of luck to all!

Strong SupportApple has been bouncing from this demand zone for awhile now, this huge momentum is gonna catapult us to $194 with a 1min gap down from today from the credit card news. We'll see $194 by the end of next week! NASDAQ:AAPL

APPLE: In danger of repeating the Bear Cycle fractal.AAPL could be on the verge of completing November's insane rally that restored bullishness on the 1W chart and keeps the 1D technical outlook in green (RSI = 64.212, MACD = 3.520, ADX = 54.247) as it is failing so far to cross over the LH trendline of the Bearish Megaphone pattern. A structure that up until now is identical to the Megaphone that led to the 2022 Bear Cycle.
In fact the correction started on the current leg we are at that got emphatically rejected on the LH line. After the 1D MA50 failed to support, the selloff (first of that Bear Cycle) extended as low as the 1.618 Fibonacci level. Currently that is at 150.00.
Conversely, on January-February 2023 rally, it was the 1D MA50 that held and provided Support, which in turn had the uptrend continue and extend considerably higher to July's All Time High. Consequently, if the 1D MA50 holds, expect a similar March-July 2023 type continuation of the uptrend, especially if the Fed decides to finally step in and start cutting the Interest Rate.
## If you like our free content follow our profile to get more daily ideas. ##
## Comments and likes are greatly appreciated. ##

🍎Apple🍎 is Ready to Fall at least ➖5%🍎 Apple is moving in the 🟡 PRZ (Price Reversal Zone) 🟡.
💡If we look at the last 4-5 Apple candles in the daily time frame , we can see some Bearish Reversal Candlestick Patterns at the same time: Evening Star Candlestick Patten, Shooting Star Candlestick Pattern, Bearish Harami Candlestick Pattern.
💡Also, another sign of the end of this upward rally can be shown to us by the Stoch RSI indicator .👇
🔔I expect Apple to have a bearish trend in the coming days and at least fall to the 🟢 Support zone($182.95_$181.30) 🟢 and fill all the 🔵 Gaps 🔵.
Apple ( AAPLUSD ) Analyze, Daily time frame⏰.
Do not forget to put Stop loss for your positions (For every position you want to open).
Please follow your strategy; this is just my Idea, and I will gladly see your ideas in this post.
Please do not forget the ✅' like '✅ button 🙏😊 & Share it with your friends; thanks, and Trade safe.

Decoding Apple's AI Strategy: A Hidden Gem in Generative AIDecoding Apple's AI Strategy: A Hidden Gem in Generative AI
In the AI landscape, Apple's ambitions often take a backseat, but underestimating its potential could be a mistake. This article explores why Apple might emerge as a significant player in the evolving AI space.
Apple GPT: A Strategic Response to Generative AI Dominance
While ChatGPT steals the spotlight, Apple is gearing up with Apple GPT, positioning itself as a formidable contender in generative AI.
Billion-Dollar Commitment: Apple's Strong Bet on AI Development
Investing up to $1 billion annually, Apple shows a strong commitment to narrowing the gap in generative AI, leveraging its financial strength.
Financial Fortitude: Apple's Impressive Cash Flow Fuels AI Investments
With $101 billion in free cash flow, Apple's reported annual spend of $1 billion positions it for significant AI integration.
Learning and Adapting: Apple's Advantageous Strategic Entry
Learning from competitors, Apple focuses on safety and data privacy, delivering a superior product with strategic insight.
Global Reach: Apple's Vast User Base as a Strategic Asset
Despite a delayed entry, Apple's network of over 2 billion active devices globally is a substantial asset for polished AI offerings.
Underrated AI Buy: Apple's Measured Approach and Promising Future
As an underrated buy, Apple's AI-enhanced devices present exciting prospects for consumer enthusiasm and increased demand.
Conclusion: "Strategic Patience: Apple's Long-Term Vision in AI Integration"
While not leading the AI race, Apple's strategic timeline suggests long-term success in AI integration, making it a worthwhile investment for patient investors in the evolving tech landscape.
Our preference
Above 182.50 look for further upside with 200 & 210 as targets .
