AAPL SELL ++++Appl at the top of downtrend line, sell signals, bearish moon phase starts tomorrow sell those aaples ladies and gents!
AAPL34 trade ideas

APPLE POSSIBLE DIAGONAL only BULLISH WAVE COUNTThe chart posted is that of AAPL 4 hr chart If we are to see the 5th wave this would be the high likely be the formation if the BULL IS INTACT

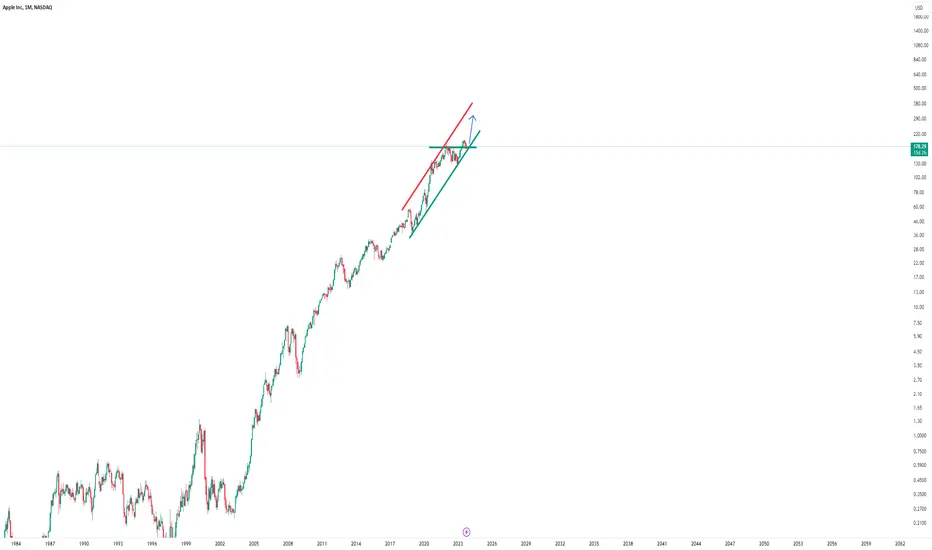
The historic +40% pattern on AppleHello Traders and Investors,
My name is Philip and I am a German swing-trader with over 4 years of trading experience.
I only trade the higher timeframes, preferably the monthly chart, because this allows me to capitalize on the major market swings.
I view trading as a long term game over the next 20 years which will help me to build massive wealth - it is not a get rich quick scheme.
-------------------------------------------------------------------
Today I want to share with you my outlook on Apple:
Apple is in a massive uptrend and if you look at Apple's chart over the past 20 years, there is no doubt that this was a crazy chart history. We also always had breaks and retests of the previous highs which were followed by crazy pumps and I do expect the same thing to happen again.
-------------------------------------------------------------------
Most of the people always follow the quick money. But the quick money is never the big money.
They think that making 5% a month consistently is reasonable, which is one of the reasons why so many traders fail.
The only think which you can control is your risk, everything else is unknown.
Keep your long term vision!
APPLE Inc short oppcurrent price is still respecting the down trendline
clear rejection on 12 & 13 oct candle on D1 , probably
completing the Lower High of the downtrend.
maybe we will see a down breakout within this week or this few days. i personally will wait for short opportunity and my 1st take profit target will be 168.00 which is the previous low

IS THIS WAVE FOUR ??? Wait for confirm !Greetings, dear friends. I hope you are having a productive week.
I want to share my market analysis ideas based on the Elliott Wave Principle with you.
I am a fan of this principle and follow all the rules and guidelines for analyzing the market.
However, please note that my ideas are based on my personal experience and may change over time.
If there is an error in my analysis, I am open to re-analyzing it from the beginning and learning from my mistakes.
It's important to understand that making an error in analysis is not a fault, but evading responsibility is.
No one can analyze financial markets with 100% accuracy, but it's remarkable how close we can get.
We analyze from multiple perspectives to consider all possibilities.
Let's mention a few opinions and ideas!
Based on mathematics.
I am still practicing to understand the Elliott Wave Principle better and hope to provide an even better analysis in the future.
Thank you for your continued support, and I look forward to our mutual success.
Best regards,
Mr. Nobody
Keep trying and never give up.
Good luck!

Apple’s IPhones Off to Disappointing Start in ChinaApple Inc.’s new iPhone 15 is selling far worse in China than its predecessor, according to separate analyses, reflecting stubbornly weak consumption as well as the rise of rivals like Huawei Technologies Co.
Sales of Apple’s flagship device are down 4.5% compared with the iPhone 14 over their first 17 days after release, market tracker Counterpoint Research estimated in previously unreported figures provided to Bloomberg News. Jefferies analysts led by Edison Lee reckoned sales of the iPhone 15 were down by an even sharper double-digit percentage from its predecessor after Huawei outsold Apple overall, powered by the surprising debut of the Mate 60 Pro.
The twin reports mark a potential blow to Apple at a time it’s grappling with the weakest smartphone demand in a decade and a backlash from overheating models. If the initial estimates are accurate, they represent one of the iPhone’s worst debuts in China since around 2018, when local names like Oppo and Vivo began to captivate Asian consumers.
Counterpoint blamed the iPhone’s slump in China mainly on an economy struggling to rebound from its Covid trough. And it stressed that in the US, the iPhone 15 likely posted a double-digit rise over 2022 in the first nine days of sales.
But the iPhone’s debut in China came weeks after the launch of the Mate 60 Pro, celebrated as a triumph over US sanctions because of its advanced made-in-China processor. It also coincided with a government mandate to expand a ban on iPhone use to government agencies and state companies, underscoring Apple’s growing challenges there.

AAPLAAPL analysis, from M TF i seethat price is in a Retrecement Phase to the Down Side at Least to M Discount and M FVG

Join the Apple Boom and Reap Incredible Benefits!
The juggernaut that is the iPhone user base is soaring higher than ever before! 📈📱 Yes, you heard it right! As an esteemed trader, this extraordinary growth presents an unmissable opportunity for you to become a part of the Apple success story.
With every passing day, our beloved Apple brand is captivating millions around the globe. Not only has the iPhone user base expanded exponentially, but it continues to surpass all expectations. Such staggering growth inspires confidence in Apple's exceptional potential for your investment portfolio.
By joining forces with Apple Inc., you can embrace a new era of extraordinary returns. 🍏💰 As the iPhone user base grows, so do the countless opportunities to maximize your profits. Indulge in the prospect of investing in an iconic, technologically pioneering company that remains ahead of the pack. Seize the chance to ride the waves of success alongside Apple, the visionaries who revolutionize the digital landscape.
So, let's not just stand on the sidelines and watch this phenomenal growth unfold. I wholeheartedly encourage you to jump on board and long Apple stock today! Let's enjoy the immense wave of prosperity together.
For further details and personalized assistance, please feel free to comment below.

AAPL 2u week but not a strong close Look at multiple time frames, and see:
red 2 down day last Friday
week still a green 2 up, but notice how it took out previous week high(s) and then crawled back close to last week's high
similarly to what NASDAQ:QQQ and AMEX:SPY did
aggressive (institutional) buying -with likely continuation- tends to close at the high
instead, the weekly has a bit weaker look to it now
IF THIS THEN THAT
IF AAPL will get back into the weekly range
THEN we might see 171 area again ....

APPLE: Short Trade Explained
APPLE
- Classic bearish formation
- Our team expects pullback
SUGGESTED TRADE:
Swing Trade
Short APPLE
Entry - 178.89
Sl - 183.48
Tp - 169.52
Our Risk - 1%
Start protection of your profits from lower levels
❤️ Please, support our work with like & comment! ❤️

US 30 OUTLOOKlast week price was able to retest the resistance at 34027 and gave us the bearish engulfing candle to continue dropping

Apple Stock Price Struggling To Fall Below 171!Apple price has been ranging for 9 weeks and seems to have found a temporary bottom at 171. In coming days, price expected to decline to retest 173 level and if price is rejected, then the stock price likely to surge towards 196. However, failure to hold price at 173, will cause price decline to decline further...
N.B!
- AAPL price might not follow drawn lines . Actual price movement may likely differ from the forecast.
- Let emotions and sentiments work for you
- ALWAYS Use Proper Risk Management In Your Trades
#aapl
#apple

AAPL Weekly Harmonic Elliott Wave and Hurst's Cyclic AnalysisOverview:
let's review the key points of the previous update (October 6th):
Wave x of 2 as a triple zigzag.
179.31 or 180.29 potential targets for wave x peak.
October 9th the first 10D cycle of the current 40D cycle.
40D FLD generates a target of 184, I think we will not meet this target.
20D cycle trough in the range of 15th to 18th of October.
80D trough in the range of 25th October to November 7th.
Update:
we are perfectly on track of our expectations. We peaked at 182.34 this week and started the wave y of 2.
Analysis of the Structure:
We are in wave II of (a) of y of 2.
Analysis of the Cycles:
On Friday October 13th, we got the first 5D cycle trough in the second 10D cycle of the first 20D cycle of the second 40D cycle of the current 80D cycle.
There are not any major FLD crosses to the downside yet to help us with coming up with targets.
The 10D FLD can be crossed to the downside next week, which can generate a target of 176.3 to happen on the October 18th (20D cycle trough).
No change to the time that we expect the 80D cycle trough, 25th October to November 7th (I prefer November 6th or 7th).


AAPL potentially triggers the outside week down.... 2u-2d on the daily
exited a small OTM call play, as it didn't close above Thursday's high
still 2u on the weekly, but <177.99 it's back into the weekly range...
IF THIS THEN THAT
if it takes out 177.99 and keeps going, next weekly pivot is 170.82
below that 167.62 (previous monthly low)
#TheStrat

APPLE My Opinion! SELL!
My dear friends,
APPLE looks like it will make a good move, and here are the details:
The market is trading on 178.89 pivot level.
Bias - Bearish
Technical Indicators: Supper Trend generates a clear short signal while Pivot Point HL is currently determining the overall Bearish trend of the market.
Goal - 174.99
Recommended Stop Loss - 181.47
About Used Indicators:
Pivot points are a great way to identify areas of support and resistance, but they work best when combined with other kinds of technical analysis
———————————
WISH YOU ALL LUCK

AAPLThe beginning of the downward trend and the formation of a new path, I expect the price to fall to a certain range

APPLE: Pullback and breakout buy levels.AAPL reached the top of the 1st Channel Down pattern, staying over the 1D MA50 on a green 1D technical outlook (RSI = 58.956, MACD = 0.610, ADX = 38.858). This rise originated after nearly hitting the 1D MA200, its continuation may very well do so on the 1D MA50.
Our trading strategy is to buy if it closes a 1D candle over the dotted line and target the 2nd Channel Down and the dashed line (TP1 = 185.00). A new crossing there would target the R1 level (TP2 = 190.00). If it fails to close a candle over it and gets rejected, we will buy just inside the Demand Zone and pursue the same target set. A Bullish Cross on the 1D MACD gives an edge to the upside.
## If you like our free content follow our profile to get more daily ideas. ##
## Comments and likes are greatly appreciated. ##

AaplStopped at resistance...
Headed back to 175 minimum here ..
If this drops below 175, then 165 gap close most likely incoming.

Road to the moon: The Flattening of AppleRoad to moon is never easy, if it was easy it wouldn't be valuable.
Down before up is like a slingshot, the harder you pull one way, the stronger and faster it goes the other way.

$AAPL: 180 Not Bad?Apple is showing reslience in this market along with broader marquee names while growth continues to struggle

How to Trade the Gap & GoWelcome to the final instalment of our 7-part Power Patterns series where we aim to give you the skills to trade powerful price patterns which occur on any timeframe in every market.
Last but by no means least is the Gap & Go pattern. Price gaps epitomise power and the Gap & Go is must for any active trading looking to take advantage in a spike in volatility.
We’ll teach you:
How to identify the best Gap & Go patterns
Why the catalyst behind the pattern is crucial
A simple technique for managing a Gap & Go trade
I. Understanding the Gap & Go:
The Gap and Go pattern revolves around a simple concept: market shocks take time to fully price in.
A price gap occurs when a stock "gaps" higher or lower from its previous closing price when the market opens. The price gap represents a shock and in certain circumstances traders can anticipate a continuation of price movement in the direction of the price gap.
Here are the key components of the Gap & Go trade setup:
Identify the gap: The first step is to identify stocks that exhibit a noticeable price gap between the previous day's closing price and the current day's opening price. This gap can be either bullish (a gap up) or bearish (a gap down).
Breaking structure: The price gap should break above or below a level of resistance (or support). Gaps that break key structural levels are likely to draw in a higher level of participation.
High volume: The price gap should occur on higher-than-average volume. Higher volume indicates increased participation and suggests that a significant number of market participants are actively reacting to the news or event that caused the gap.
Bullish Gap & Go:
Bearish Gap & Go:
II. Know the catalyst behind the gap:
Stock prices can gap higher or lower for a multitude of reasons and some of the reasons make better trading catalysts than others.
As a general rule, you want the gap to form on a piece of stock-specific newsflow that has recalibrated market expectations.
Remember, central to the pattern working is that the shock which caused the gap must take time to price in – hence mechanical events such as dividends and corporate actions are of no use, so too are confirmed bids.
The best catalysts for Gap & Go trades will be earnings surprises (good or bad), and a change in outlook (good or bad). In general, trading updates tend to lead to more surprises that Interim and Annual Reports, as they occur within reporting periods.
Good catalysts:
Trading update
Interim results (change of outlook)
Annual results (change of outlook)
Bid rumour
Broker upgrade / downgrade
Bad catalysts:
Ex dividend
Corporate actions
Global news event
Confirmed bid
Top Tip: For the stocks you like to trade, make sure you add a calendar alert for when the company releases Trading Updates and Interim/Annual Reports. This may help you to anticipate price gaps.
III. How to Trade the Gap & Go:
Whilst the Gap & Go pattern can be traded in many different ways and on many different timeframes. We favour getting to grips with this pattern on the hourly candle chart first. On this timeframe gaps will be clear, levels of risk can be kept relatively small, and trades can play out across one or two trading days.
Here’s how to start trading the Gap & Go on the hourly candle chart:
Entry : Wait for prices to stabilise following the opening rotations. The gap should be maintained after the first hour of trading and there should be no signs of exhaustion. Enter during the second hour of trading.
Stop-loss placement : Traders can either place a stop above (or below) the 9 period exponential moving average (EMA) or use a multiple of the Average True Range (ATR) above (or below) the entry price.
Price targets : The expectation for the Gap & Go trade setup is to catch a clean swing of price movement in the direction of the gap. For this reason, the 9EMA is a useful tool as a dynamic profit target – traders should close their position on a close back above (or below) the 9EMA. This method does not cap upside in fast moving markets but ensure discipline and allows traders to attempt to capture the ‘meat of the move’.
Bullish Gap & Go Trade Setup:
Bearish Gap & Go Trade Setup:
IV. Managing risks and pitfalls:
Be wary of opening reversals: It is important that prices stabilise and maintain the gap before entering a Gap & Go trade. On occasions, prices will gap lower only to reverse sharply during the first hour of trading. The stronger your understanding of the subtle nuances of trading around the open, the better you will be at trading the Gap & Go pattern.
Risk management: The Gap & Go pattern by definition is trading during an expansion in volatility. Therefore, it is essential that traders implement proper risk management techniques, such as position sizing and diversifying your trading portfolio.
Disclaimer: This is for information and learning purposes only. The information provided does not constitute investment advice nor take into account the individual financial circumstances or objectives of any investor. Any information that may be provided relating to past performance is not a reliable indicator of future results or performance.

#AAPL Pivotal Trendline Test In this update we review the recent price action in Apple and identify the next high probability trading opportunities and price objectives to target
PAST PERFORMANCE NOT INDICATIVE OF FUTURE RESULTS
