Stocks pairs trading: AFL vs METAnalyzing the financial metrics and market dynamics of AFLAC Incorporated (AFL) and MetLife, Inc. (MET) provides valuable insights for investors evaluating their investment portfolios.
Reasons to Consider Buying AFL Over MET:
P/E Ratio: AFL's P/E ratio of 10.11 is significantly lower than MET'
40240.00
0.01BRL
7.88 BBRL
334.18 BBRL
About MetLife, Inc.
Sector
Industry
CEO
Michel A. Khalaf
Website
Headquarters
New York
Employees (FY)
45 K
Founded
1868
ISIN
BRMETBBDR004
FIGI
BBG009W9NDN6
MetLife, Inc. engages in providing insurance and financial services to individual and institutional customers. It operates through the following segments: Group Benefits, Retirement and Income Solutions (RIS), Asia, MetLife Holdings, and Corporate and Other. The Group Benefits segment offers group life insurance products with renewable term policies. The RIS segment contains short and long-duration products, including capital market products, pension risk transfers, structured settlements, and other benefit funding products. The Asia segment focuses on Japan only and offers traditional life insurance, and accident and health products. The MetLife Holdings segment includes traditional and universal life products. The Corporate and Other segment refers to surplus investment portfolios used to fund capital and liquidity needs. The company was founded on March 24, 1868 and is headquartered in New York, NY.

MET ,,, Pullback Uptrend
Pullback to the broken price level has been finished after this bullish candle. You consider it a s a good buying opportunity by setting sl below the level and targeting at about 77 .
This chart is my favorite one because the trend is clean and clear with the lowest amount of fluctuations.

MetLife , buy opportunity Uptrend
Although the indices are in a correction wave but In my view this char is going to get next target in a short time. By setting a good SL, you can think on getting buy position on it.

2024 Q1 Long: Met-Life (MET)Amazing company, and in times of uncertainty, one thing is certain. These healthcare providers are not leaving. These could be names that excel in 2024.
If rates are cut substantially, it is natural for people to flock back into the stock market. While dividend games will get a lot of the love, if t

MET - BULLISH SCENARIOFounded in 1868, MetLife, Inc. is one of the biggest international providers of insurance, annuities, and employee benefit programs, With 90 million clients in more than 60 countries. The company operates in 5 segments: United States, Latin America, Asia, EMEA, and MetLife Holdings. The United State

$MET with a bullish outlook following its earnings #Stocks The PEAD projected a bullish outlook for $MET after a positive over reaction following its earnings release placing the stock in drift B with an expected accuracy of 50%.
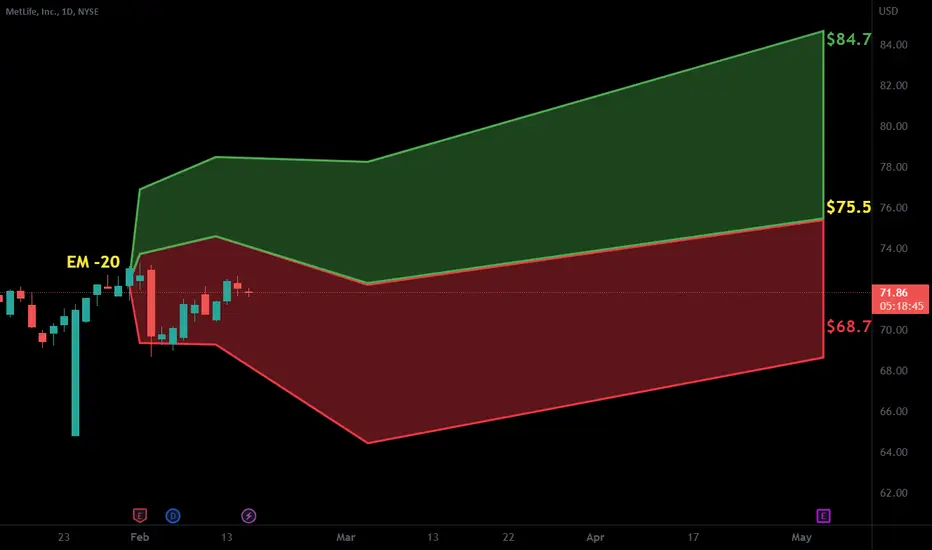

$MET with a Bullish outlook following its earnings #Stocks The PEAD projected a Bullish outlook for $MET after a Positive over reaction following its earnings release placing the stock in drift B with an expected accuracy of 60%.

$MET with a Bullish outlook following its earnings #Stocks The PEAD projected a Bullish outlook for $MET after a Negative over reaction following its earnings release placing the stock in drift C with an expected accuracy of 50%.

MET - Strong Uptrend PresencePost this large rising wedge formation price has recovered back to the major up trend line and has poised itself above this trend line
Areas in green rectangles are very similar price / indicator situations
Areas in white are drops below the Trend Line
Bullish Potential

See all ideas
Trade directly on the supercharts through our supported, fully-verified and user-reviewed brokers.


Curated watchlists where METB34 is featured.
