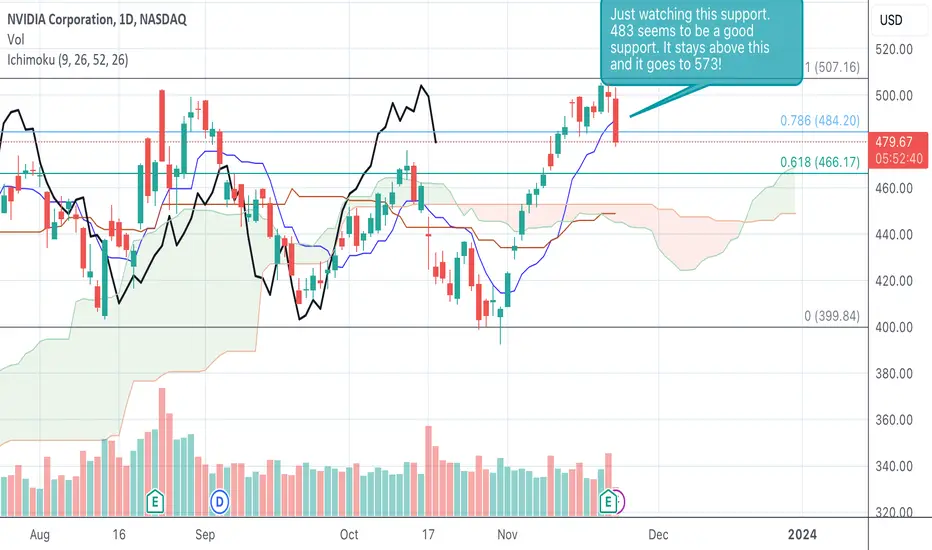
Update on $NVDA Daily. Updated support and targetThis is for my learning and storing it for eternity. Collaboration is a good idea and posting it for educational purpose only. Slow and Steady wins the race
NVDC34 trade ideas
NVIDIA is at balance. Here are my long/short scenariosWhen you trade the Model of the Medianlines/Pitchforks, you know now that price of NVDA is at balance.
Why?
It's at the Center-Line.
From here Chances for up or down are equal weighted
Details?
Well, price closed above the CL. This is bullish.
Price usually pull back to it.
Then it should continue to the other extreme, which is the Upper-Medianline-Parallel.
If it fails it's target and instead open and close below the CL, we have a short at hand.
OK, so how could we play either side?
LONG:
After the pullback to the CL, I watch for a upside continuation. I want price closing above a previous candle. Stop/Loss goes below the CL.
Profit target is the U-MLH.
SHORT:
After a open/close below the CL, I'm short immediately and my stop is above the highest Bar above the CL.
Profit target is the L-MLH.
Save trading4all

Nvidia to $550 by year end 2023Nvidia report yet again another amazing quarter. This stock goes to $550 by year end in my opinion, there is not a more obvious trade out there right now....

NVDA DEC 24Just looking at this being a possible channel. if it is, seems like a good time to get in.

A Deep Dive into NVIDIA's Financial SuccessNVIDIA , a leading player in the world of accelerated computing and artificial intelligence, has once again demonstrated its financial robustness and strategic foresight in the technology sector. The company's recent financial report for the third quarter ended October 29, 2023, reveals a remarkable growth trajectory, emphasizing NVIDIA's significant role in the evolving landscape of computing and AI.
Record-Breaking Financial Performance
NVIDIA's revenue for Q3 reached a staggering $18.12 billion, marking an impressive 206% increase from the same period last year and a 34% rise from the previous quarter. This growth trajectory is not just a testament to the company's innovative products and services but also reflects the increasing demand for advanced computing solutions across various industries.
The GAAP earnings per diluted share stood at $3.71, a more than twelve-fold increase from last year and a 50% increase from Q2. The Non-GAAP earnings per diluted share were even more striking at $4.02, showcasing nearly six times growth from the previous year and a 49% increase from the preceding quarter.
Data Center Dominance
A significant contributor to NVIDIA's success is its Data Center segment, which reported a record $14.51 billion in revenue. This figure represents a 41% increase from Q2 and an astounding 279% increase from the same period last year. The introduction of innovative products like NVIDIA HGX™ H200 with HBM3e memory and the integration of NVIDIA Spectrum-X™ Ethernet networking platform in servers from major tech companies like Dell Technologies and Hewlett Packard Enterprise have been pivotal in this growth.
The Generative AI Revolution
NVIDIA's CEO, Jensen Huang, attributes the company's robust growth to the broad industry transition from general-purpose to accelerated computing and generative AI. The company has positioned itself at the forefront of this revolution, offering comprehensive solutions like AI foundry services and NVIDIA AI Enterprise software. These offerings are rapidly being adopted by various sectors, including large language model startups, consumer internet companies, and global cloud service providers.
Future Outlook and Strategic Moves
Looking ahead, NVIDIA expects its Q4 revenue to be around $20.00 billion. The company continues to innovate and expand its product line, evident in its recent launches in the gaming sector and professional visualization. For instance, the introduction of DLSS 3.5 Ray Reconstruction for enhanced gaming experiences and the release of TensorRT-LLM™ for Windows reflect NVIDIA's commitment to staying ahead of technological advancements.
Diverse Growth Areas
Beyond data centers and gaming, NVIDIA has made significant strides in professional visualization and automotive sectors. The company's collaboration with Mercedes-Benz to use NVIDIA Omniverse for creating digital twins of manufacturing and assembly facilities exemplifies its influence in professional visualization. In the automotive sector, NVIDIA's partnership with Foxconn to develop next-generation electric vehicles underscores its strategic vision.
Conclusion:
NVIDIA's latest financial report is not just a display of numbers but a narrative of a company that is effectively navigating the rapid advancements in technology. With its continued focus on innovation and strategic partnerships, NVIDIA is not just achieving financial success but is also shaping the future of computing and AI. As the era of generative AI takes off, NVIDIA stands as a pivotal player, driving growth and innovation in a world increasingly reliant on advanced computing solutions.

SELL NVIDIA AFTER EARNINGS 350 TP Market sentiment Sell OFF
Sell Nvidia from 500 - 510
Stop Loss 550
all the way back to 450 TP - TP SELL OFF 350 FINAL
be patient until December 2023 - January 2024
CAFE CITY STUDIO
Put your Stop Loss Because thats your Insurance !!!

$NVDA Fib and Ichimoku Target Long $520 if stays above $500NASDAQ:NVDA Fib and Ichimoku Target Long $520 if stays above $500
Again this learning exercise as of 11/21/2023

NVDANVDA earnings today
I took previous all-time high to cyclical low distance and made an extension of equal size above, from previous all-time high, which gives us targets to upside
525 (ez imo)
580 bull case

Nvidia Q3 Earnings Preview: Unprecedented AnticipationNvidia (NVDA): Q3 earnings released after New York close on Tuesday 21st November.
Riding the AI Wave to New Heights
Nvidia's upcoming earnings release is poised to be a seismic event in the tech world, and the anticipation is palpable.
The chip maker has been riding the crest of the AI wave, catapulting its share price to stratospheric heights, hitting an all-time high just a day before the earnings report.
Now, all eyes are on the figures: Wall Street analysts expect Nvidia to deliver Q3 earnings-per-share (EPS) of $3.39 and revenue $16.11 billion . These numbers represent an astonishing surge compared to the previous quarter's already impressive growth.
The projected earnings call holds the promise of yet another triumphant performance, but it's a high-stakes game. Nvidia must not only surpass its own sky-high expectations but convince the market that this growth rate is sustainable. Any deviation from these astronomical forecasts or a hint of subdued future guidance could trigger profit-taking.
Technical Outlook
On Nvidia’s daily candle chart (below) the shares have been range bound since August. Having bounced from the bottom of the range at the end of October, the shares are trading at the top of the range as we head into earnings.
A key benefit of trading is that you can remain unbiased and trade what you see – taking a long or a short position in response to how the market reacts.
Bullish Scenario: The Break & Retest
Should Nvidia break higher on a stellar set of earnings this would set the scene for a potential Break & Retest trade in which traders can expect broken resistance to provide support. For more information on the Break & Retest pattern see the link at the bottom of this page.
Bearish Scenario: The Fakeout
Should Nvidia fail to live up to the market’s sky-high expectations and prices break back below resistance, this could setup a potential Fakeout trade in which traders can short the reversal at resistance. For more information on the Fakeout pattern see the link at the bottom of this page.
NVDA Daily Candle Chart:
Past performance is not a reliable indicator of future results
Disclaimer: This is for information and learning purposes only. The information provided does not constitute investment advice nor take into account the individual financial circumstances or objectives of any investor. Any information that may be provided relating to past performance is not a reliable indicator of future results or performance.

NVIDIA Incredible strength long-term. Is $1100 realistic?NVIDIA Corporation (NVDA) gave us a great bottom buy entry last time (October 22) we made a call on it and invalidated the Head and Shoulders pattern (see chart below):
This time we look at it on the 1W time-frame where it is on the 4th straight green weekly candle, approaching the Higher Highs trend-line. The 0.236 Fibonacci retracement level and the 1W MA50 (blue trend-line) provide Support, while the 1W RSI is on a Bearish Divergence (Channel Down) but the 1W MACD is about to form a Bullish Cross.
The last we had the above combination of indicators, was February 16 2021. At the time, the 1W MACD failed to make the Bullish Cross and the stock pulled back to the 1W MA50 but when it formed the Cross on April 12 2021, it broke above the Higher Highs. What followed was a 7-month rally to the -0.618 Fibonacci extension.
As you can see, the symmetry between the two fractals is striking. When the MACD Bullish Cross takes place, we would assume a similar rise and the -0.618 Fib target will be at $1100. Is that in your opinion realistic for Q3 2024?
-------------------------------------------------------------------------------
** Please LIKE 👍, FOLLOW ✅, SHARE 🙌 and COMMENT ✍ if you enjoy this idea! Also share your ideas and charts in the comments section below! This is best way to keep it relevant, support us, keep the content here free and allow the idea to reach as many people as possible. **
-------------------------------------------------------------------------------
💸💸💸💸💸💸
👇 👇 👇 👇 👇 👇

NVDADon't worry about getting a stop, it happens two or three times in every chart, which is completely compensable

$NVDA Implied Move for EarningsNASDAQ:NVDA Implied Move for Earnings
So this is absolutely NOT an analysis - it is simply the implied move for NVDA for Earnings tomorrow straight from what options are saying

NVDA... See What I Did Here....?Textbook mixed with a little thought process then check against 10 different indicators all pointing me in the same direction... either im right and equivalent to an indicator or im wrong and im equivalent to an indicator...

Nvidia Earnings tomorrow! Place your betsNvidia made a new all time high today.
We will see if it can continue beating its revenue 20% Quarter over quarter.
Resistance & Support is clear.

NVIDIA all time high and upside levels to bear in mindOn the monthly chart should NVDA continue it's course of action, the upside Fib extension levels of 1.618 and 2 to watch out for is between 620 - 738.

NVDA earnings 11/21/23NVDA earnings are next Tuesday, 11/21/23, at 4:20pm. NVIDIA (NVDA) reported earnings of 2.79 per share on revenue of 13.51 billion for fiscal Q2 ending July 2023. The consensus earnings estimate was 2.09 per share on revenue of 11.09 billion. The company beat expectations by 30.99% while revenue grew 101.48% on a year-over-year basis. The company said it expects third-quarter revenue of 15.68 billion to 16.32 billion, with gross margins of approximately 72.5%, which implies non-GAAP earnings of 3.17 to 3.47 per share.
Q3 October 2023 consensus:
EPS = 3.16
Revenue = 16.12 B
Moving averages:
SMA50 = 443
SMA100 = 447
SMA200 = 369
AVWAP = 350
Angle of trajectory:
6 month = 460
YTD = 523
4 year = 358
Options data:
Exp Date Put/Call OI
2023-11-17 0.9756
2023-11-24 0.7594
2023-12-01 0.6115
2023-12-08 0.7662
2023-12-15 0.7986
2023-12-22 0.8062
2023-12-29 1.2591
2024-01-19 0.9816
2024-02-16 0.7802
2024-03-15 1.552
2024-04-19 2.1658
2024-05-17 1.7528
2024-06-21 1.1359
2024-09-20 1.4871
2024-12-20 0.9676
2025-01-17 1.5738
2025-06-20 1.1192
2025-12-19 1.0876
2026-01-16 1.1469

NVDA: Approaching an All-Time High! Don't be Greedy.NVDA has reached a critical resistance area, as evidenced by the yellow area in the chart above. Although a pullback would be plausible in this circumstance, there is no bearish chart structure suggesting a possible correction, and there is no top signal today.
Since it hit the previous support at $403.11 (red line), NVDA has rallied relentlessly. So it's important to keep in mind that if NVDA is about to correct, now would be the perfect time. We just need more confirmation.
Confirmation is important because we can’t possibly know the future. Remember, trading is reactive, not predictive. Let’s take the reaction observed on October 31 as an example (red circle).
On October 31, NVDA did a fantastic bullish reversal candlestick pattern, a Hammer, which acts as a bullish reversal roughly 60% of the time, according to Bulkowski’s studies (Encyclopedia of Candlestick Charts, p.348). This reaction has occurred right after NVDA hit the $403.11 support line, a critical support level that was making many investors nervous, as it was the neckline of a “possible” Head and Shoulders chart pattern, as seen in the weekly chart below.
However, as long as the price doesn’t close below the neckline, the pattern won’t be triggered, which is why I used the word “possible”. Investors who were betting on a breakout were frustrated by the Hammer pattern on the daily chart, which rejected the thesis of the H&S pattern.
As one of the greatest and most controversial traders that ever lived once said:
“To anticipate the market is to gamble. To be patient and react only when the market gives the signal is to speculate.”
- Jesse Lauriston Livermore.
Therefore, although NVDA is trading at a critical resistance level, near the all-time high, and it is having a hard time to break it, we don’t see any top signal confirming a pullback yet – but we might see one soon.
If NVDA corrects, we can expect that it would seek its next support levels, like the $476.09 or the 21 ema on the daily chart, and this wouldn't ruin the bull trend. In fact, it might be just another buying opportunity. I’ll keep you updated on this, so consider following me to keep in touch with my analysis.
Best regards.
Nathan.

NVDANVDA bull case is it mirroring its current extension above previous all time high on an earnings pop
544-570

Bearish Scalping Opportunity for NVDIA. As always thank you for watching my analysis. Please watch as I explain why I think NVDA is going down and will be a good short-scalping opportunity. And as always, keep your charts clean! NASDAQ:NVDA

💵 E a r n i n g s J o u r n a l📶 S T A T I S T I C A L A N A L Y S I S
Current 50-Day Market Trend: long/buyers/positive.
Next Swing: negative swing to support.
Next Wave: sell wave to the mean.
Next 50-Day Market Trend: long/buyers/positive.
Trade Type: Touch & Go don't wait for a close.
💵 E A R N I N G S A T A G L A N C E
Market Capitalization: 1.218T
Release Date: 11/21 AMC
Quarter: FQ3'24
_______________________________________________
Revenue Anticipations: positive surprise of Revenues.
Revenue Surprise-Confidence: on a scale of 0-9, #1
Revenue 2-Year Trend: the company trend in Revenues is positive.
_______________________________________________
EPS Anticipations: positive surprise of EPS.
EPS Surprise-Confidence: on a scale of 0-9, #5
EPS 2-Year Trend: the company trend in EPS is positive.
_______________________________________________
📝 S Y N O P S I S
🟢 Buy ~ If the earnings report is above the Wall Street consensus, I expect the market will buy the +surprise.
⚪ Neutral ~ If the earnings report is released with complicating press, I expect the market will avoid the surprise and invest in alternative securities.
🔴 Sell ~ If the earnings report is below the Wall Street consensus, I expect the market will sell the -surprise.
🔎 R E S E A R C H D E P T H
Technical Analysis: daily chart.
Fundamental Analysis: EPS & Revenue data.
Press/News: none.
Social Media: none.
☝️ P R O V I S I O N
The analysis presented is incomplete work thereby can't safely trade in the Market by itself.

NVIDIA PUTSThe weekly price action is completing a double top formation and daily price confirmed bearish outlook with lower high.
Expecting the price to drop to $440 area, and given that its weekly tf forming double top, price will probably go even lower to areas of support like around $410.

NViDIA, potential Buy based on AlgoSignal StrategyThe current price exhibits promising upward signals according to my algorithmic system, meeting various criteria. These include rising trading volume, an upward trend indicated by prices above EMA20 and EMA50, and the closing price surpassing VWAP. As a result, the present conditions suggest a potential upward trend.

Nvidia Maintains Lead in AI MarketNvidia's strategy of expanding into cloud services aims to reinforce its market position. The company's financial health is robust, with profit margins nearing 25%, significantly outpacing AMD's 4%. This stark contrast in profitability underlines why Nvidia may continue to be a more attractive investment option compared to AMD. Despite projections hinting at AMD's faster growth in 2024, Nvidia is expected to hold onto its leadership position.
Tech giants and investors are closely watching these developments. who holds positions in both AMD and Nvidia as well as other tech firms like Microsoft, Amazon, and Intel (NASDAQ:INTC), considers his investment in AMD as a strategic hedge against his larger stake in Nvidia. Meanwhile, Meta Platforms (NASDAQ:META) has opted not to challenge Nvidia's GPU capabilities for AI tasks, further cementing Nvidia's dominance in the market.
As the AI revolution demands more processing power, both companies are likely to remain critical players. However, for now, Nvidia's combined hardware-software offerings give it an edge reminiscent of Intel’s past market dominance but with the added leverage of being a crucial software provider akin to Microsoft.
