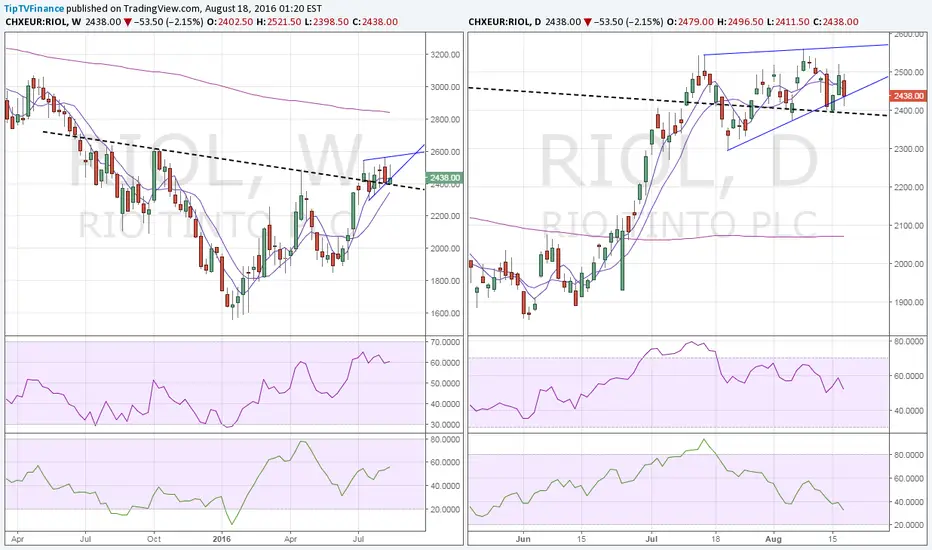
Rio Tinto – Inverse H&S breakout on weekly Rio Tinto weekly chart shows inverse head and shoulder breakout, although subsequent rise has been capped repeatedly around 2550 levels.
On the daily chart, both the RSI and money flow index suggest increasing bearish pressure on prices.
Hence, we could a minor drop to 2390-2350 area.
However, overall view stays bullish unless the weekly close is below neckline support level.
RIOT34 trade ideas
LON:RIO Corrective with Short Term Sell OpportunityHi Everyone, there is a sell setup for RIO -0.89% on the London Exchange.
It is in a corrective ascending triangle which we are waiting for to break down and out of. A high risk entry is available on lower time frames now which could bounce up off the lower trend line but otherwise we will wait for the break and retest of the lower trend line for the sell.

RIO TINTO SHORTBig price drop on MN chart, then typical correction and now possible secound down move of price. I took signal order from D1 chart.

Rio Tinto share price is in consolidation phrase.Even though there is Rio Tinto's New Boss is welcomed by the market and commodity price is supported are the good news to sell.


