TSLA34 trade ideas

Members Daily Analysis March 6Regional Bank volatility - showing sings of fear and weakness.
Gold new all time high - showing fear
Semiconductors strong: Apple, MSFT, AMZN, TSLA, Google weak
Vix makes bullish reversal off lows.

TSLA: Small Buy continued by Big Buy or SellNASDAQ:TSLA
Tesla has been going down lately, however:
- As we have been in a downtrend, having a sell crowd technical indicators such as RSI, are oversold, indicating a buy signal in 1D and 4H time frames. MACD looks like popping up.
- Trends: Well we are in a downtrend so nothing bullish about that, however, we are on the downside of a downtrend and as the downtrend is big, moving up even inside this bear market is a good 20%. Now zoom in on timeframes check 1H, we are making a falling wedge reversal pattern, which is a bullish one. So nothing mega bullish here, but looks like there might be a small good margin to be made here. Not confirmed yet.
- News and Reports: Q4 2023 is not looking bad IMO, some might disagree. They have not made the points Analysts expected them to make, so one might say they have underperformed, but if to look at it from the general perspective the company has still doubled from the previous year. Other news is first time in history(if I am not mistaken) Chienes EV producer BYD have beaten them in sales.
Now my opinion on this one is mainstream news tries to make it look like a bad stock to buy, so to buy would be the right strategy. We are in a downtrend showing some potential to reverse but nothing is confirmed yet, with some technicals showing buy signals (which usually does not mean sh.t). I am just watching for now waiting for reversal confirmation to jump in on buying for a 20% increase, and there we will see if we are breaking the downtrend to go up further.
For now just watch.

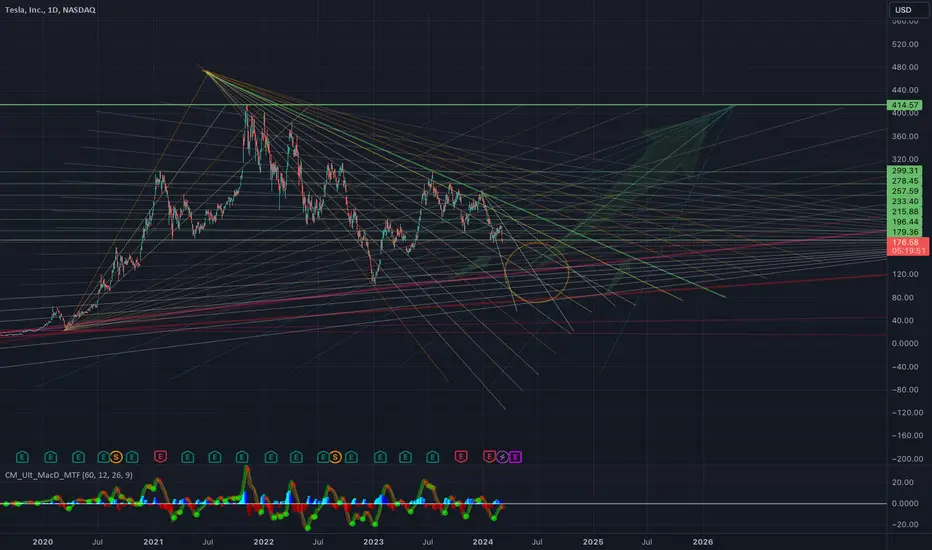
Tesla Break Point & Dream entry $TSLA bottomAlways step back, take a look at the big picture. Here, you can see we have this crazy four-year-old solid-resistant base trendline that really only proved itself in 2022 when Tesla dropped all the way down to what seemed like it was going to be a bottom. Many of us got in for the first time at $100, just thinking like, 'come on, there’s not that far down you can go.' That seen resistance trendline has now grown, so the base is around $133, up into $150 over the next few months. So, it’s like a $20 baseline and it could be a heavy pull because you can see it really wants to go down there again, and if it does, you can see, like it did back in 2020, then that’s kind of its restart, re-emergence, and that area would be towards the end of August 2024. We would start seeing what next year would look like, so that would be also a perfect moment in time for it to launch back off. So, there’s a lot of manipulation going on in the market right now because it’s such a strong point of relief. Short sellers are in there, long buyers like me are waiting. I hope it goes down here. I’m excited to buy more. I bought when it went down to $100. I sold when it got—I sold too early, but I sold when it got to around $270, and then it peaked out at $300, came back down, so I think our next rally it’s gonna definitely pop above $300 and probably retest that $420 top before it bounces again downward. I didn’t put that in here on this chart, but maybe I will now that I’m thinking about it, looking at something like 2026 anywhere between 2025 and 2026 for a return to that $416-$420 area and then probably in the drop and hopefully a breakthrough. Then we’ll see what the technology holds.
Why I technically feel, Tesla is ready to build 30X againKeep It Simple and Trade With the Trend.
As a trader, you have probably heard the old adage that it is best to "trade with the trend." The trend, say all the pundits, is your friend. This is sage advice as long as you know and can accept that the trend can end. And then the trend is not your friend. There are multiple ways to spot trends, direction, and momentum.
So how can we determine the direction of the trend?
Let's take a look on the KISS rule, which says, "Keep it (as much as possible) simple, stupid!" Here is a method of determining the trend, and a simple method of anticipating the end of the trend.
Before we've started, it should be mentioned the importance of time frames in determining the trend. Usually, when we are analyzing long-term investments, the long-term time frame (one-week or larger) dominates the shorter time frames. However, for intraday purposes, the shorter time frame could be of greater value. Trades can be divided into three classes of trading styles or segments: the intra-day, the swing, and the position trade.
Large commercial traders, such as those companies setting up production in a foreign country, might be interested in the fate of the currency over a long period of such as months or years. But for speculators, a weekly chart can be accepted as the "long-term".
Averages Moving in Pairs
With a weekly chart as the initial reference, we can then go about determining the long-term trend for a speculative trader. To do this, we will resort to two very useful tools that will help us determine the stage of the trend. These two tools are the simple moving average and the exponential moving average.
Going further and keeping in mind all the mentioned above rules, lets build the trend.
Darlings, well graphed Tesla stocks trend is still the same as in 2019, where it started 30x gain.
Anybody tried to get all the path at those times? There's a chance you'll miss it again!

TSLA bull setup - need to brake above this trend. #TSLA NASDAQ:TSLA
TSLA bull setup need to brake above this trend or to be a chewing toy for bears.
waiting for a base pattern to emerge and a brake above for entry. breaking below the 21EMA is used for exit.

Tesla Share Price To Brush off Negative Earnings The price looks to be reversing at the 62% retrace.
Has put in a Head and Shoulders pattern on the daily time frame.
Great time to add to long positions.
Trendchanges and its author are not registered financial advisors. Everything that is documented by Trendchanges and its author within the news letter or online should be interpreted as market commentary and not as investment advise or instructions to buy or sell any financial asset.
Trading and investing carries risk and you should fully understand the risks involved.
Its recommended that you confer with an independent financial advisor who can assess the risks for your own financial situation. This is important as trading can result in the complete loss of your capital. If trading on margin losses can exceed your original deposit.
Trendchanges and its author will not accept any liability for any losses resulting from the use of the material presented if readers do decide to take action as a result of information communicated in the newsletter or online.
Although every effort is made to insure the accuracy of the information contained within this publication, Trendchanges and its author does not guarantee the accuracy of the information, either from the content within or from any external third part links which my be used.
Past trading performance is not an indication or guarantee of future results.

tesla I believe that Tesla stock will rise from this point as a result of the accumulation and purchasing operations, targeting the indicated prices

TSLA Stock Price Falls Over 9% in Just 2 DaysTSLA Stock Price Falls Over 9% in Just 2 Days
The day before yesterday, trading in TSLA shares began at an opening price of USD 199.34; trading yesterday closed at a price of USD 180.51. The fall in TSLA shares led Musk to lose the title of the world's richest man to Jeff Bezos.
The main driver of the decline in the price of TSLA shares was news:
→ about the temporary shutdown of the Giga Berlin plant in Germany after an arson set by a group claiming that the company led by Elon Musk is devouring “land, resources, people”;
→ that deliveries of electric cars from the Shanghai plant have dropped to their lowest level in more than a year — which may indicate fierce competition with Chinese manufacturers.
It also became known that Morgan Stanley analyst Adam Jonas is lowering his target price from USD 345 to USD 320 and predicting a decline in sales for FY24.
Technical analysis of the TSLA stock chart shows that:
→ The TSLA stock price is moving in a downward channel (shown in red), acting noticeably weaker than the broader market.
→ In March, the median line acted as resistance.
→ The price was unable to consolidate above the round level of USD 200 (in November last year it worked as support).
If the bearish momentum continues, TSLA price could reach the channel's lower boundary around USD 170, renewing its 2024 low. Even lower is important support at USD 155, formed from a gap last January and tested in April.
On the other hand, the current decline may turn into a profitable opportunity in the long term.
As it became known this week, Cathie Wood's ARK funds are increasing their long positions in TSLA shares. And respected analyst Daniel Ives said on CNBC that Tesla's growth story isn't dead and it's just going through a "brutal transition" that could be linked to deteriorating communication due to the company replacing its chief financial officer last year.
This article represents the opinion of the Companies operating under the FXOpen brand only. It is not to be construed as an offer, solicitation, or recommendation with respect to products and services provided by the Companies operating under the FXOpen brand, nor is it to be considered financial advice.


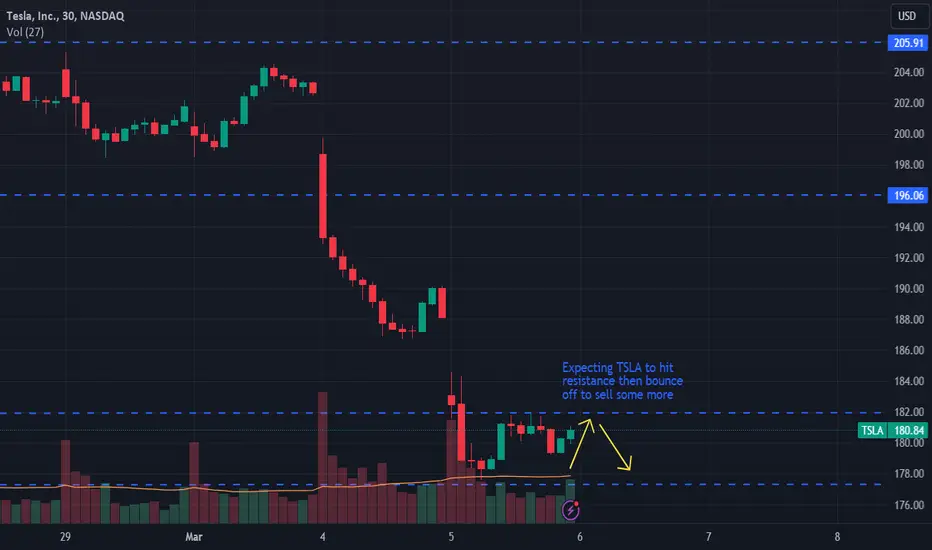
TSLA breaks below its support and tries to recoverTSLA has gone through a significant sell off recently from its high of 200. After breaking below its support line its has recovered some.
This does not appear to be a false breakout down as the stock has failed to recover enough to be above the resistance.
We should expect it to bounce off the resistance level and sell off some more.
Overall I remain bearish for the next month or so as the stock market starts its decent and Tesla is sensitive to market cycles

tesla tesla in the 3m iam looking for continuation of the 4th leg with a possible target at 66. tsla tesla

Here we go againlooking like a small repeat of the last couple days. gap down on open, hoping for a bounce or a break down. we shall see what 4am brings

TSLA BullsTSLA has buying interest at 185 levels because of the bullish engulfing candles at this key level.

a weekly price action market recap and outlook - tesla #2Good evening and i hope you are well.
I did not adjust my wave outlook since 2024-02-11 and so far it's pretty perfect. My thesis is we are in w3 and this will be a treat. Late and perma bulls are still long and or will buy 180/175. So if this bear channel breaks down, the short covering will be epic.
Market was/is at the strongest and this stock is in a broad bear channel. The next months the earnings will deteriorate and then we will see where the market thinks this stock is fairly priced. All bubbles pop or deflate, this is deflating. Elon won't even save it with 69 new AI announcements for the reminder of the year. If sh** really hit's the fan, he will be margin called because of x financing and this will fuel the sell off further.
bull case: Bulls pray that 175 will hold and they buy the double bottom. If it holds, they want to touch the upper bear channel line around 240 again but i would expect 200 to be bigger resistance then.
bear case: Price action wise was this a wedge bear flag which broke down and now market will test 175 if there are more buyers than sellers. Not rocket science so far.
short term: wait for market reaction at 175 and follow the trend there. we might go sideways first but i think the general market sell off will accelerate over the next weeks
medium-long term: down - what would change that? trading above 270

TSLA undervalued relative to Magnificent 7
Support Case:
I've spotted a reverse head and shoulders indicating a reversal to the upside (bullish) up into the region of 212-206. Additionally there's a zone below the left shoulder at 178 down to 162 where Tesla has bounced from previously. So pretty good support from what I can see.
Bullish Breakout Potential:
I've drawn a symmetrical triangle from the most recent price action starting on February 16th, forming through today the 22nd of February. I'm targeting the 212-206 region for a price on TSLA for this bullish set up to reach. I've bought 255 Strike Calls on TSLA at $0.76 each, looking to sell them back at a higher price.
Let's see how this goes, and happy trading.
* Magnificent 7 comparative analysis. While the rest of them have been doing quite well for the most part, Tesla seems to be the laggard in the pack. While I do think the Magnificent 7 is an AI bubble, with actual results to come in the next 2-5 years from this tech, this seems to be an overinflated exuberance. While being cautious, I'm still playing TSLA for this reason.

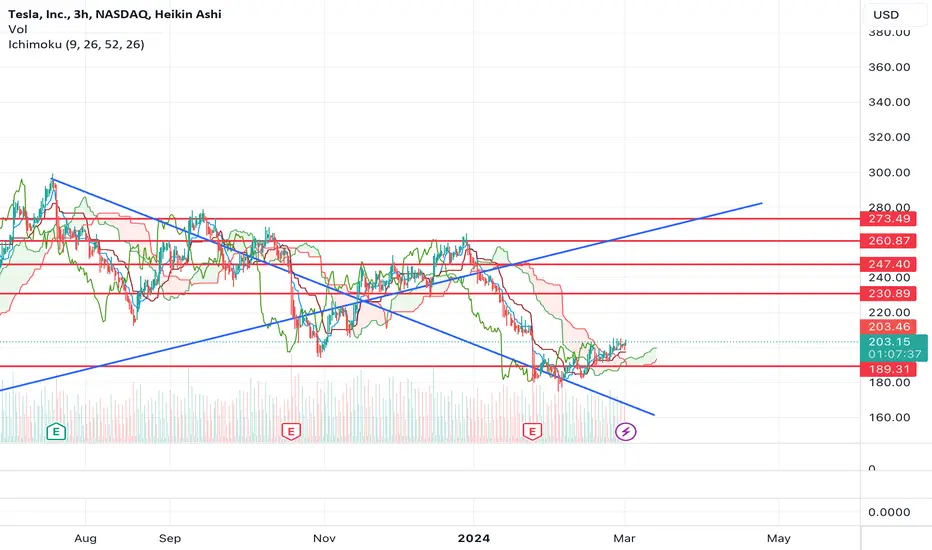
Tesla is looking very bad. 150 is my targetIn mid-December of last year, NASDAQ:TSLA broke above the falling trend line. At that point, I predicted a continuation upward to the next resistance level at 300.
However, after initially rising to 263, the price began to reverse and what initially appeared to be a resumption of the upward trend turned out to be a major false break.
In January, despite prevailing optimism in the stock market, Tesla's price trajectory remained bearish, diverging from broader market trends.
Moving closer to recent days, the 200 support level was broken with a gap, signaling another major bearish sign. Currently, the gap has been filled, and Tesla is testing this support level as new resistance. Considering the imminent correction for US indices, we may witness a significant drop in Tesla's case.
I anticipate a target of 150 for this drop, although, to be honest, the 100 zone is not out of the question.

$TSLA wants higher. $230-260 targetEveryone is bearish TSLA and has been for weeks, which makes me like this idea as a long.
Once TSLA breaks $204, we should see a strong move higher. I've marked off key resistance levels to the upside that I think TSLA could make a move to.
Let's see what happens over the next couple of weeks.
Tesla sellBearish trend, reaction at the resistance line, bearish market structure, bearish engulfing candle,

TSLA - Dip and Rip : under 198 dip before a move to $210Idea here is for price to dip under 198 before a turn around long push to $210 as a first target.

Tesla new loyalty program in China. Stock trading idea for 5/03/Tesla Inc., the renowned electric vehicle manufacturer, introduced an innovative loyalty program aimed at expanding its customer base, particularly in China, which boasts the world's largest automotive market. This strategic move comes amid Tesla's fiercely competitive pricing battle with key rivals, including the notable BYD. The loyalty program stands out for including insurance subsidies intended to enhance the appeal of Tesla's offerings to potential buyers.
This enticing incentive is available to all customers purchasing a Model 3 or Model Y by the end of March 2024. Tesla's objective with this initiative is clear: to significantly bolster its market presence in China by making its vehicles more accessible and attractive to a broader range of consumers.
In light of this development, Tesla Inc.'s (TSLA) financial performance has garnered increased attention, particularly among investors and market analysts. A thorough analysis of Tesla's stock chart provides valuable insights into its current market position and potential future trajectory.
On the daily (D1) timeframe, a critical resistance level has been identified at 215.65, with a strong support level at 180.06. The probability of the stock testing the support level, followed by an attempt to breach the resistance, is considered high by market analysts. This indicates a potential turning point for Tesla's stock, offering a strategic opportunity for investors.
For those closely monitoring the hourly (H1) timeframe, engaging in long positions near the 180.06 support level appears promising, with an immediate target of reaching 215.65. Looking ahead, maintaining a long position with a medium-term perspective could potentially lead to achieving a target of 241.48. This approach underscores the importance of closely watching Tesla's stock movements, offering valuable insights into the company's market dynamics and investment potential.
—
Ideas and other content presented on this page should not be considered as guidance for trading or an investment advice. RoboMarkets bears no responsibility for trading results based on trading opinions described in these analytical reviews.
The material presented and the information contained herein is for information purposes only and in no way should be considered as the provision of investment advice for the purposes of Investment Firms Law L. 87(I)/2017 of the Republic of Cyprus or any other form of personal advice or recommendation, which relates to certain types of transactions with certain types of financial instruments.
Risk Warning: CFDs are complex instruments and come with a high risk of losing money rapidly due to leverage. 66.02% of retail investor accounts lose money when trading CFDs with this provider. You should consider whether you understand how CFDs work and whether you can afford to take the high risk of losing your money.

TESLA Under Pressure! SELL!
My dear friends,
Please, find my technical outlook for TESLA below:
The instrument tests an important psychological level 202.66
Bias - Bearish
Technical Indicators: Supper Trend gives a precise Bearish signal, while Pivot Point HL predicts price changes and potential reversals in the market.
Target - 196.76
About Used Indicators:
Super-trend indicator is more useful in trending markets where there are clear uptrends and downtrends in price.
———————————
WISH YOU ALL LUCK
