Somethings brewing before earnings $ANot looking too good with this weekly H&S. In my experience the steeper the neckline the harder she falls.
A trade ideas


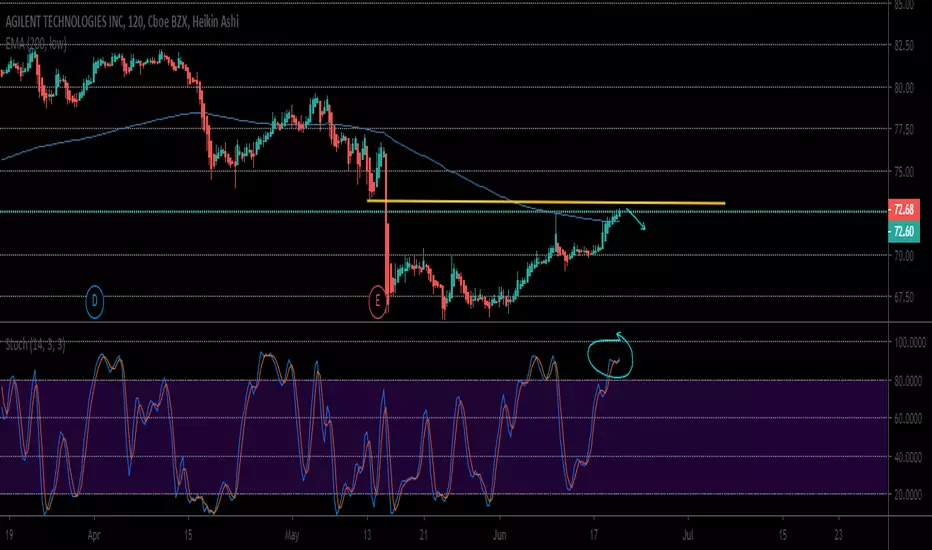
Agilent Technologies Inc (A) july 16Looks like we may get a reversal by the end of today. Note that we are currently 61.8% retracement with a strong directional candlestick at the bottom. Looking for a potential reversal by end of day today in which our minimum upside target will be $71.46. If we break through the lower support of at the 61.80% retracement (or $70.18) to the downside> look for a target of $66.02. Note shown here, are the technical indicators giving a strong signal that a reversal may be possible. Also, please note the vertical grey timing lines on this chart. We are looking at the dates August 2 and/or September 4 before the next major strong directional trend (up or down) may begin and price will probably consolidate between the above ranges until then.
NYSE:A
You dont know me yet, but you will.
*Please like, and follow my page for more great Harmonic pattern, Elliott wave, Gann, Astro, and Trend analysis.

A - Bull Put Credit SpreadPA sell off last few days to Mid BB% & 200 MA
Daily RSI Oversold
Found S&R at 73. Looking for consolidation and then reversal to mean back higher.
Aiming for 72.50/70 Put Credit & 75 Call option for Directional bias higher.
Exp Aug 16 but selling to close in Profit well before that.!
Good Luck - Watch YOUR RISK

Short A - Hedge PlayThis is just a hedge play for the other long plays.
it's had a solid run, it could either gap fill or reject off that resistance hard like before.
"A" Bearflag Sell offLooks like it broke support from the highest point recently, A is selling off, bearflag with target at $71 for me.
This is a paper trade.

"A" Short Idea I bought a call credit spread against "A" 72.5/77.5 Credit spread exp June 21st Fill Price 2.49
Earnings are tomorrow but due to the uncertainty in the air with the whole tariff move courtesy of trump everything that recently looked good will look less good because everyone will be skiddish. Let's see how it pans out.
Max loss $2.51 + commission
This is a journal entry and not trading advice.


$A Agilent Technologies strong into earnings We will be looking for a long into earnings depending on the market behavior today. The company is expected to beat earnings and revenues easily and the chart points to further gains if the $74 range can hold.
Average Analysts recommendation BUY
Average Price target $88
Company Description
Agilent Technologies, Inc. engages in the provision of application focused solutions for life sciences, diagnostics, and applied chemical markets. It operates through the following segments: Life Sciences and Applied Markets, Diagnostics and Genomics, and Agilent CrossLab. The Life Sciences and Applied Markets segment offers application-focused solutions that include instruments and software that enable to identify, quantify, and analyze the physical and biological properties of substances and products, as well as the clinical and life sciences research areas to interrogate samples at the molecular and cellular level. The Diagnostics and Genomics segment comprises activity providing active pharmaceutical ingredients for oligo-based therapeutics as well as solutions that include reagents, instruments, software, and consumables. The Agilent CrossLab segment includes startup, operational, training and compliance support, software as a service, and asset management and consultative services.


Long ABT on Breakout!Order set to buy ABT above the high of the current base. Good form with good contractions and declining volume.


Looking For A Retrace on AWe have a confirmed top here, RSI is turning down, looking for this to retrace back to the 23.6 fib level and even to the 36 fib. Given the stall from the overall market, this should be fairly swift.

AGILENT TECHH4
if going long
must break the upper trend line to sustain the uptrend
if going short
break of 20 MA
break of initial support 75.11
on a bearish divergence


picture perfect H&S?Doesn't come any prettier than this... Look for a retest of the top trendline in the broadening wedge on a gap up in the next few days. Then short this puppy back to lows on a broader market selloff that's coming in the next wk.

Calling a Top on Aligent$A is approaching ATH near $75. It's formed a nice Butterfly Pattern, but I think we'll see a pull back in the coming days. Look for the top to be formed this week, with a decline down to $70 area. Potential 7% swing.

$A Agilent Overbought at Resistance$A Agilent looking overbought approaching all-time high $75 resistance. RSI & MFI both entering overbought territory on 9th straight green day today . Playing for a near-term pull back setting up for a possible long term cup & handle breakout to new all-time highs if it's able to turn back up.
Note: Informational analysis, not investment advice.

Short A (monthly double top wait for breakdown to confirm)monthly breakdown in my indicator, retested and hold the breakdown trendline. Two short TP: 50, 40

$A Agilent Bullish Hammer$A Agilent holding trend line support nicely today with a bullish hammer candle forming on the daily chart. Expecting a near term bounce. Targeting a return to $75 by early November.
Note: Informational analysis, not investment advice.

Bullish DayMulti-time frame indicating bullish day made from successive, uninterrupted bullish marubozus.

$A symmetrical triangle setup$A channel suggests we're at the top and heading lower before earnings. symmetrical triangle break will tell us more.

A = Dividends Happen Today & Then What??Trading is as complicated as you want to do it. I prefer simple. When you look at A stock daily chart, what do you see? Yes, those rascally Wrabbits had a dividend day today (over a short, mid week holiday week). If you look at last three divdend days, the rest of this week and next week were bullish, or next at least 10 days.
How can you benefit from this in your face price action on daily chart. How about either doing a Option Call credit spread, weekly sell puts (because you then collect premium) and act like casino or bankers, whom win more then buyers. I believe that price action will fill in noted GAP on chart and hit $69 to $70 near the next noted earning report in August. You can win in trading with a solid foundation of wisdom and commonsense. Cut your loses quickly and let profits run. Will be looking at Call credit spreads and/or maybe selling weekly puts underneath current price action. Wish you well and stay safe. Be Happy.
