GME: Contrarian Play Of The Day
DEATHCROSS AT 29$
GameStop CEO:
We're doing everything we can to move our stock price
GME trade ideas


The state of GME (and WSB)Hello, GME seems to trade between a diagonal resistance zone and a horizontal support.
Once the support breaks thing propably will get very ugly.
I have to say its wierd that gme is still trading this high after so long, not a typical bubble chart. Gme ape´s are strong in this one, but are they strong enough?
Instead of building on a fundamental roadmap justifying current prices the ceo chose to go the shorttermed NFT hype road.
This is ridiculous management and once more confirms to me that GME prices and fundament are diverging growingly.
If there´s another resistance test its a good opportunity to short it to death.
Fundamental value should be arround 16 USD so be careful and only invest what you can afford to loose if you are long.
The whole GME hype was nothing more than a pump and dump basically by WSB and its propably a good choice to cut losses before we tank down for real.
Like so many stocks WSB picks. The earlier people realise this the better. WSB is a pump and dump Forum basically.
Im leaning towards a crash soon altho im surprised and confused that the price is still so high after all this time.
In 2022 we will propably see MEME stonks get back to "fundamental" value. Doesnt matter if its doge or gme or anything else.
DYOR and please leave a like.

GME again... Maybe Set For Launch?Hopeful thinking again, but I'd like to point out the very bull flag shape we are descending within - along with a myriad of indicatiors I've accumulated throughout the year.
Again, just hopeful thinking.
BUT I THINK UP.
Thank you.

GME 76 supportGME has retraced to the 76 support level. If the last move up was a bull break this should be about the low of the drop. Entering long around 100.
Tight stops just under the 76. If the bull move here fails on the 76 there's no reason to hold long positions. If there are bulls in the market we should see a strong move up some time in the next 3 days.
Buying some 150 calls for June on GME.

Up, Down, Forward for sureGap at 125 closed. My guess for tomorrow is to test or break 120. following the trend of the past few days. We have been setting lower lows and lower highs. I am still eyeing 112, and a possible gap fill around 94-95.
lot of volatility in the the overall market too. the markets responding to the big cap earnings is absolutely bonkers. I'm doubting reality. nothing typed here is financial advice and it's all a fever dream.
Remember its all priced in.

GMENot financial advice.
The essence of investing & trading is the intelligent and patient preying on the greed, fear, impatience, addiction and ignorance of the majority. It's definitionally Darwinian.

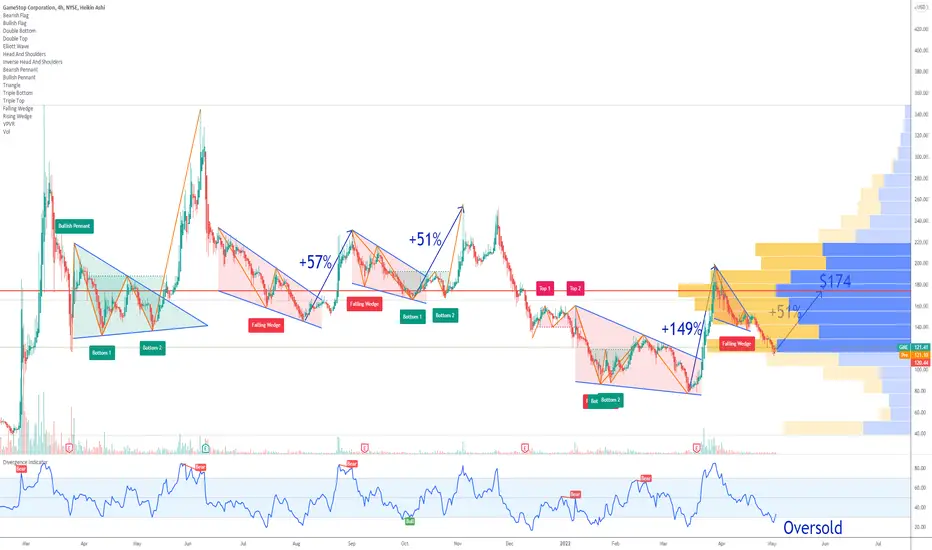
GME Falling Wedge PatternIf we don`t take into consideration the fundamentals of the company, instead we look only at the technical analysis, every falling wedge of GME ended up with a rally higher than 51%.
That could be our price target too, $174 (+51%).
Looking forward to read your opinion about it.
GME 7 Weeks Short, 4 Weeks Runup, 1 Week Turnover - A Clear CyclHere is the GME chart.
Vertical lines denote starts of periods. I have some fun triangles too just for giggles.
You'll see here a clear pattern. 7 weeks to short, 4 week runup, 1 week to I don't know what, restart the short cycle I guess. Given that the total is 12 weeks (approx quarterly) I think that fits pretty well with the quarterly options expiration. I don't really understand the cycles all that well but this DD is probably helpful to reread: reddit.com/r/Superstonk/comments/pb22oj/the_puzzle_pieces_of_quarterly_movements_equity/
Obviously we had two runup cycles back-to-back with 1 week in between in Q1 2021, and so I have PREDICTIVELY included 2 cycles for Q1 2022 as well. This decision is running loosely on the back of some DD I can't recall that showed the options/ETF cycles occurred twice in January.
It is ENTIRELY possible that the early cycle in March doesn't occur this year and that subsequently we are in week "1" and running headlong into a 7-week short cycle. It's also possible that as I laid out, we lead a second 4-week run-up starting 2/25.

ARE. YOU. READY ?!!Piñata day is soon.
In the end we will depict true enthusiasts and believers.
My beliefs strongly stay the same.
Follow my other posts to see my expectations and beliefs.
I knew this was coming.. just not so soon.
MAKE SURE YOU ARE ONE WITH THE PURPLE RING!!
D. R. S.

GME Symmetrical wedge with upside bias.Weekly chart of $GME Gamestop. Beautiful bounce off the 200 VWAP; still needs to clear the 50 VWAP. MACD has crossed and RSI has plenty of upside room to move. My thinking/bias is that this will go to the upside.

I just like drawing #GameStopI just like to draw coloured lines and overlay current bars with history on the $GME 30 min chart.
Looks to me like another buying opportunity coming up until the next catalyst like Opex, Dividend record date, NFT marketplace.
In the mean time high inflation, rising interest rates, supply chain issues, component shortages, housing market crash, stock market crash, war. (All transitory, we're assured by the powers who are suppose to know)
Luckily RC had the foresight to buy a lot of inventory before supply chain issues started and high inflation kicked in. That can now be sold at the current inflated prices, still cheaper than the competition, supporting gross profit.
Not advice, do your own DD.


it's comingoh lawd you know it's coming. monthly chart, please zoom out and in. yellow trendline is a bullish channel. red channels are bearish. blue is thee ultimate channel that the stock has mostly traded in since in 2002. 2002. MOASS.

analysis GME-uptrendOn GME we have a big probability of an uptrend because as you see on the chart we have a breakout with force the vwap indicator by a big candle with a large volume.thanks.

Elliott Wave Intraday Analysis: GME Is Looking HigherHello traders and investors!
Today we will talk about short-term intraday GME structure in which we see pretty nice and clean bullish setup formation, at least for a three-wave (A)-(B)-(C) rally away from the lows.
As you can see GME made sharp and impulsive rally in March that belongs to first leg (A). In Elliott wave theory, after every five waves, we can expect a three-wave pullback before a trend continuation. So, currently we are tracking an A-B-C corrective setback within wave (B) that can be slowly approaching the end, as we see it moving in final stages of wave C of (B). Ideal support in Elliott wave theory is at the former wave 4 and golden 61,8% Fibonacci retracement which comes around 125 level, so final subwave "v" of C can be still missing.
What we want to say is that we should be ready for more gains within wave (C), but ideally once current wave (B) correction fully unfolds. Of course, there's a chance for bigger or more complex wave (B) correction, but the count remains valid as long as it's above 77 invalidation level.
Trade smart!
If you like what we do, then please like and share our idea!
Disclosure: Please be informed that information we provide is NOT a trading recommendation or investment advice. All of our work is for educational purposes only.

GME last call. Short Unfortunately for holders, GME will continue to decline to these supports. Till it is locked in this triangle, there is no chance for upward move.

GME Fib Levels and Gap. Nothing Has changed Like I told you,
Like I said,
Steal your face right off your head.
- He's Gone
Look at them Levels Hit. Read my past TA. Nothing has Really changed. Looking at it through a 3 hour view.
We touched the 1.61 in my short term fib levels. If we drop below this I am expecting a Gap fill @ $125. Possible bottom arround $112 to swing back up. Fib Traders like swinging between the .38 and .61
Become Bull closing over 163.
Still looking at a down side in the short/ mid term, or at least until June when the vote to split goes through.
Let me know your thoughts.

GME on the reboundThe meme stock still feeling vibrations from its huge bull run last year. Looks like it may be on a bearish trend that could reverse if the pennant holds true. If the stock breaks the formation to the upside, expect it to run up to the top trend line between $160-180.
RSI is not showing signs of Divergence so on the other hand, GME may continue down and test the $80-90 range support

GME EWT (1d) (April 2022)Gamestop Corporation (April 2022)
Just another update, hopefully this chart is a bit cleaner than last. I believe gamestop can crash to at most, $38 before making a wave higher again, although $20 ranges sound reasonable as well.
Tradingview has broken the fractal scaling in any of my charts older than April 2022, but I'm still going to attach the ideas that led up to this one below, some just might look broken when loaded as an interactive chart but the thumbnails should show the general idea.
My elliott wave analyses could be wrong at any moment , this is practice solely for educational purposes. Please do your own research as always!
Previous charts leading up to these conclusions:
Thanks for tuning in :) Disclaimer, anyone in the trade needs to do their own due diligence and decide what is right for YOU. My charts can be wrong at any time and it's very important that you have your own strategies and plans in place. I run this channel for my own educational purposes of learning to trade, and I will never be 100% right, so please do not let me confirm any bias for you! (Dangerous to do so, stay safe and remember the basics & rules of risk assessment.) Expect the unexpected and happy trading!

GME EWT (3d) (April 2022)Gamestop Corporation (April 2022)
Just another update, hopefully this chart is a bit cleaner than last. I believe gamestop can crash to at most, $38 before making a wave higher again, although $20 ranges sound reasonable as well.
Tradingview has broken the fractal scaling in any of my charts older than April 2022, but I'm still going to attach the ideas that led up to this one below, some just might look broken when loaded as an interactive chart but the thumbnails should show the general idea.
My elliott wave analyses could be wrong at any moment , this is practice solely for educational purposes. Please do your own research as always!
Previous charts leading up to these conclusions:
Thanks for tuning in :) Disclaimer, anyone in the trade needs to do their own due diligence and decide what is right for YOU. My charts can be wrong at any time and it's very important that you have your own strategies and plans in place. I run this channel for my own educational purposes of learning to trade, and I will never be 100% right, so please do not let me confirm any bias for you! (Dangerous to do so, stay safe and remember the basics & rules of risk assessment.) Expect the unexpected and happy trading!

GME EWT (1w) (April 2022)Gamestop Corporation (April 2022)
Just another update, hopefully this chart is a bit cleaner than last. I believe gamestop can crash to at most, $38 before making a wave higher again, although $20 ranges sound reasonable as well.
Tradingview has broken the fractal scaling in any of my charts older than April 2022, but I'm still going to attach the ideas that led up to this one below, some just might look broken when loaded as an interactive chart but the thumbnails should show the general idea.
My elliott wave analyses could be wrong at any moment , this is practice solely for educational purposes. Please do your own research as always!
Previous charts leading up to these conclusions:
Thanks for tuning in :) Disclaimer, anyone in the trade needs to do their own due diligence and decide what is right for YOU. My charts can be wrong at any time and it's very important that you have your own strategies and plans in place. I run this channel for my own educational purposes of learning to trade, and I will never be 100% right, so please do not let me confirm any bias for you! (Dangerous to do so, stay safe and remember the basics & rules of risk assessment.) Expect the unexpected and happy trading!

bull flag but in down trend and under 200 day moving averagersi over sold, macd crossed and could see a push up to the 200 day moving average. If the spy is dumping than gme is dumping.
