LENB trade ideas

LEN LENNAR: We Nailed This One: Looking to Stick to the PlanSee previous earnings with Reverse H&S similar to today's.
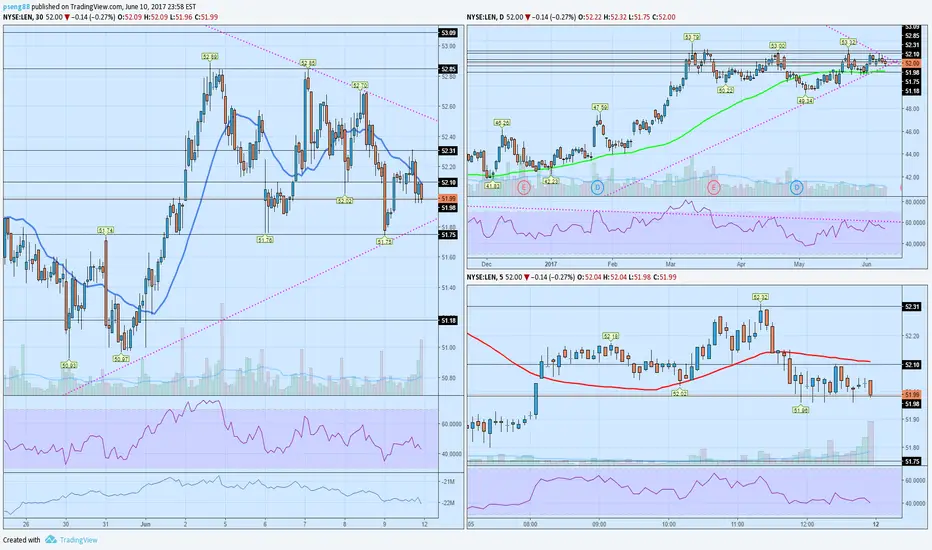
Both going into Monthly H&S, so we think after a nice pump from Reverse H&S B/O this am and a big profit we will be able to move to the short side with some very cheap puts. The green line (lower priced green line) is the measured move, but we will prob fall a bit short and then start reversing.

JUST TRADE THE RANGE, AND IT'S NOW AT THE TOP.From a technical perspective they indicators are all bearish and as earnings approach next week commentary is also very bearish which is never a good sign pre earnings, analysts never usually risk looking like fools.
Last week, analysts at Wedbush upgraded their home builder view, noting that with hearty consumer demand for housing, a supportive economy, low rates, and “reasonable” valuations, “investors should be willing to pay a higher multiple” for homebuilder stocks.
Not so fast, said a Raymond James analyst on Tuesday.
“Ahead of next week’s earnings reports from Lennar LEN, -2.62% and KB Home KBH, -3.49% , we are highlighting our increased near-term caution with the homebuilding sector by preemptively lowering ratings on the aforementioned names,” “Valuations are now trading above cyclical median multiples,” Buck Horne wrote.
AVERAGE ANALYSTS PRICE TARGET $58
AVERAGE ANALYSTS RECOMMENDATION BUY
P/E RATIO 9.39
COMPANY PROFILE
Lennar Corp. is a homebuilder company, which engages in the provision of real estate related financial and investment management services. It operates through the following segment: Lennar Financial Services, Lennar Multifamily and Rialto. The Lennar Financial Services segment focuses on the mortgage financing, title insurance and closing services for both buyers of homes and others. The Lennar Multifamily develops, constructs and manages property of multifamily rental. The Rialto segment involves in raising, investing, and managing third-party capital, originating, and selling into securitizations commercial mortgage loans. The company was founded by Gene Fisher and Arnold Paul Rosen in 1954 and is headquartered in Miami, FL.

LEN (My first publicaton)It just cannot maintain a position above its September level. RSI/price relation does show signs of a bearish divergence. I don't think it would hurt to buy a put.


short biggest home builder in late stage economic cycle.Lennar corp is becoming a short candidate since it seems like the FED will continue raising rates in 2019 and home building stats are proving to be sluggish as well. Home prices have peaked and consumers will need to tighten their belts in USA in the months to come,(1st quarter)after holiday season.
Technically, the price has been showing a consensus of uncentainty with most recently a major upside of selling volume.
I will be looking for a price entry when the baseline support gets penetrated on a 2nd,3rd or 4th attempt to the down side.
Be aware that if FED Powell decides to opt for a dovish tone on December 19th and keep the interest rate at 2.25%, the stock might get a little momentum on the long side for a short period of time.
Overall, I do believe that the economic fundamentals will weight significantly on that homebuilding sector due the fact that credit will be contracting more in the months to come.

$LEN Housing Rolling OverDouble top, 6 year trendline broke, and cut through support at $50. Downside incoming.


$LEN Downside IncomingLennar showing a massive double top and is currently sitting on support at $48 - looks poised to head lower.

US equities - 5th wave or top?Here's another US stock where there is a possibility of a 5th wave about to get going in my opinion. I have included a bearish alternative count (in red) that would suggest the polar opposite. As ever, the markets always allow to different outcomes.

Huge earnings surpriseEPS of $1.58 (beat by $1.13) and rev of $5.46B (beat by $350M). Positive trend line on the monthly should hold, IMO. Chart is currently oversold and should begin a new uptrend.

time to build new homes, like we did in 07 ! (1)this is a booring construction company, it has been consolidating forever, breakout i believe will come within 1 year


can Lennar built it?Hope everyone had a nice three days break from the market. Let’s go to the chart we are going to focus on this home builder Lennar. On my scan it shows inside bars for the day and, the week of the class of A. On the weekly chart ended with a hammer red so the question is would this stock continues to dump or reverse and, break out to new highs


October 3 Earnings: Lennar - The Luxury Housing God Lennar has had an impressive performance record with a recovering economy and housing market.
The company's continued effort on Real Estate development and Financing is fueling sales growth.
Earnings should get a boost from cost cutting and operational efficiency efforts.
Sales, however, are expected to dampen in the quarter with 120 homes deliveries postponed due to hurricanes.
Rising construction, labor and land costs are expected to damped earnings luster.
I believe the company will provide healthy guidance and beat expectations.
I'm starting Lennar with a $60.00 Price Target heading into 2018.

Trade Update ---4 days into trade---In the trade from low $52s. Added at $55.
Weekly view shown here.
Looking for strength to continue here. Currently they are testing resistance levels from the 2006 and 2007
Feedback and comments are appreciated.

Outstanding setup --Flat MA--Really loving what we have here!
Top side resistance on RSI just broken. Look for MACD zero crossing.
Notice how the 100MA is flat. Often times when a flat MA is broken, along with top side RSI resistance break, an expolsive move follows.
If you agree please leave a like.
Follow for more
Comments are always welcome
:)

$len losing momentum/distribution higher time frame is showing range bound price action- negative divergence in rsi
closer look at mid time frame shows the transition from a range expansion to range contraction and selling volume pressure being applied along with negative momentum
lower time frame shows price action in that same range contraction apply pressure to the support area with multiple retest
looking for alignment across all timeframes to tilt to the bearish side where theres is the least resistance to the downside
first level to 51.7x area and then down to 51.1x