SQ SHORT ENTRY BEARISH DEEP CRABHarmonic bearish deep crab pattern on SQ. Short entry is around $193 although we may have to hit $200 as a psychological resistance. I will be watching for a bear div on atleast the 4H chart to confirm buyer exhaustion when we get closer to the 1.618.
SQ trade ideas

ABC BullishI did not mean to put targets 2. These are targets for the ABC pattern as the V C&H targets have been reached
SQ broke from V Cup and Handle pattern and surpassed all targets
So I looked for another pattern
Just like AAPL..an abc bullish pattern had been formed
Possible stop under C but B should hold support as well and is closer.
Can be volatile
Go with your gut on this one.
Not a recommendation
Long rally, be sure to get a good entry.
It’s not about being right, but doing the right things when you are. Success isn’t in picking the stock but in how it is played once you own it. When to buy more and when to sell is far more important than knowing what to buy. One good trade can be a life changer.

SQ End Of Week Evaluation*** Comments prior to evaluation summary ***
SWIFT Projected Range for coming week: 185.09 - 206.42 (Mean: 195.76)
Trend Analysis:
The current trend is defined by the last price and it's relationship to specific moving averages.
Check the MA strategy for more specific suggestions.
Weekly: The relationship to the primary trend MA is bullish. The price in relationship to the other averages suggest long positions
Price Action:
Weekly: The average price range currently is 15.91 points/ticks/pips. Prices are currently 3.52x the normal trading range.
This distance can lead to a stall in the near future/return to the trend average.
Prices have broken through the high value of the consolidation range.
Standard Deviation
Weekly: Standard deviation suggests a range from 158.38 to 216.18 for the following week.
Calculated Price Strength:
The strength of the trend in conjunction with specific averages
Weekly: Trend strength suggests a trade range of 187.28 to 209.27 for the following week.
Price Projection:
The price action has generated a projection signal for the underlying.
Weekly: Price currently displays (if strength and attitude continue) a desire to move toward 203.18
If strength and attitude continue, it could take between 5 to 10 trade periods (weeks) to reach the projection.
Indicators Summary.
A collection of technical indicators whose directional attitude has been summarized.
Weekly: Out of the cumulative indicators monitored, 100.00% are bullish, 0.00% are bearish, 0.00% are neutral
The CCI indicator trading strategy suggest the following:
Weekly: Very strongly bullish - long entries.
Confirmation Signal
6 indicators combined to confirm entry/exit.
Weekly Bullish - Open directional trades

$SQ ( DAILY) - Cup Breakout$SQ (DAILY)
Cup & Handle breakout indicated as on 2nd Sept 2020 till 2nd Oct 2020
W pattern also formed as on 2nd Sept 2020 till 29th sept 2020
Currently breaking 100 day horizontal channel high (183.5) , however last candle was doji .
Await next candle for confirmation
9 day EMA > 21 day EMA > 50 day MA
RSI >65
Buy above 183.5 at 8th Oct close
Target Height of cup / Height of W for $36 move
OR
Target 2* ATR = $16 move


SQ shortNew high at Fib Extension 1.27
Reversal candle - shooting star
Estimate: re-test the 170 line. if so, it will form double top.
Short Entry 180
Stop 183
Target 170; reward:risk=3:1
Target 162; reward:risk=6:1
I am not a PRO trader. I need few months to practice trading strategies.
If you like this idea, please use SIM/Demo account to try it, until my trading plans get high winning rate.

dont get lost in the small timeframesthis is a great long term play. but as you can see this wont be going much higher before another pullback.. ill be looking for a entry around 160-170 . GL <3

SQ weekly correction targetsSQ is a fin-tech startup that became profitable this year. It offers online and offline payment terminals in conjunction with metrics for restaurants, retailers, accommodations and for points of sale (common small shops). While statistics helps to improve sales, SQ payment terminals accept any types of cards with relatively low fees. Moreover, it offers soft for logistics, sellers payments and staff management.
While the future of the business looks beautiful, I pay more attention to the price performance in past 3 month. It growing fast despite overall fears of economy slowdown. In my opinion, the stock's price is highly correlated to stability of economy growth in developed countries as its' main customers are small businesses in the US, Japan, Europe and Australia that hardly survive in tough economic conditions.
Hence I added some points of correction in case this week we receive some bad news for developed economies such as talks about lockdowns, bankruptcies, etc. My attention is focused on Mr. President health, lets see how COVID would effect #1 person in da world. Because if he's not safe none of us are safe.
$SQ Possible C&HSeeing a possible cup and handle forming on SQ. Could see more ATH consolidation along upper channel before returning to lower channel for "handle" portion. bullish short term

The top has been reached, downhill from here
SQ has reached a top with a completed 5 wave structure. There is bearish divergence on the RSI and MACD. Expect downside over the next few months.


$SQ daytrade$SQ - SQ daily looks ready to fly. Above the area of support will go long. With Fib extension as targets.

$SQ Square ATH Today
Super bullish setup developed in SQ, stock now back inside the long term channel, with September high as resistance.
Alert set for break above $172 for entry with the Fibonacci expansion levels as targets.

SQ- Square$SQ - Square closed at 169.61 on Friday. SQ
made a strong move after breaking
above the 158 level mentioned last Sunday.
SQ did touch the 170 resistance but failed to
hold above. If SQ can't break
above 170 this week it can get stuck range
bound between 163-170 for now. SQ above
170 should move towards 188-191.

SQ is highly bullishResisted the down of the market last days.
Very recommended with a bullish trend

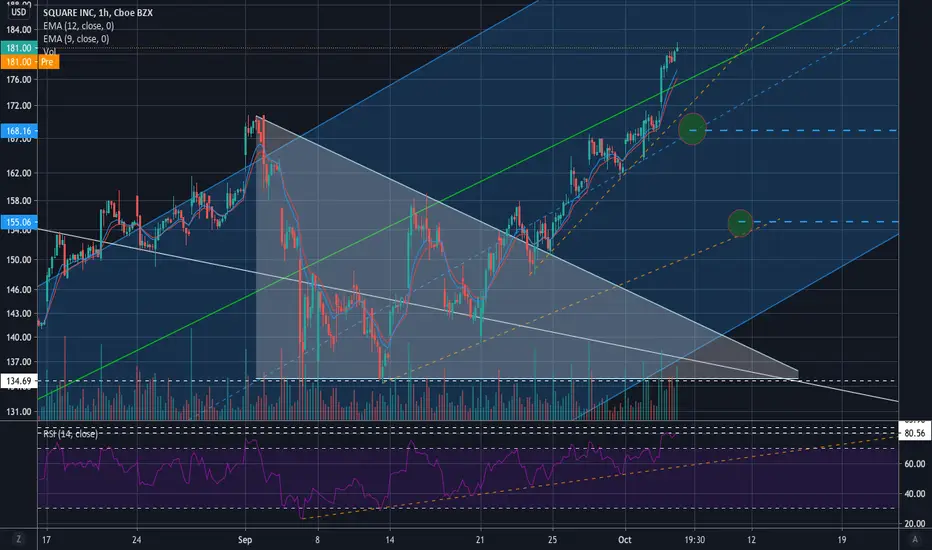
$SQ chart reviewif SQ breaks 171 it could squeeze to 181. looking for a potential day trade tomorrow.
