WIPRO BREAKOUTWipro is breaking out from triangle pattern. If retest we may see an uptrend soon . Study before invest
WIT/N trade ideas

WIPRO BREAKING TREND LINEWipro has given a breakout from its channel, Not very attractive volumes to consider a breakout yet.

Wipro falling wedge patternWipro made falling wedge pattern on D &W TF
And breakout came IT sector was also making a " W " pattern

WIPROWipro Technically Looking Weak
Closed Below 400 Today, Bearish Cross Over Of Ema 10 , 21 , 63 , 100 , 200
Observed Head And Shoulder Pattern In Daily Chart
Expected To Reach The Mentioned Down Ward Targets In Coming Days - For Decisive Up Move It Has To Close Above 63 Day Ema On Dcb
It Company - With Good Valuation After Hcl Tech
Long-Term Growth Is Intact

Wipro Falling bridge Wait For Entry Candle 🕯️ buy entry @406
Maintain Stoploss @Gagandeep11902
Target - (440-50)
2nd target - (490-500)

Wipro Hey traders this a wipro daily chart an IT sector company which is falling rapidly from last year now it making falling wedge pattern which is bullish 370 zone will be striong support zone

WIPRO LTD 60% RetracementNSE:WIPRO has retraced 60% from its top. As per analysis, this is the best time to make entry for long position.
My entry point is 380. Will wait for target of 449 & 515
Stop loss will be only 30 points (350)
Note: This is my personal analysis, only for learning.
Thanks.

Wipro short term callWipro for target price above 420. Share is recovering from bottom and now we will see higher high and higher low formation

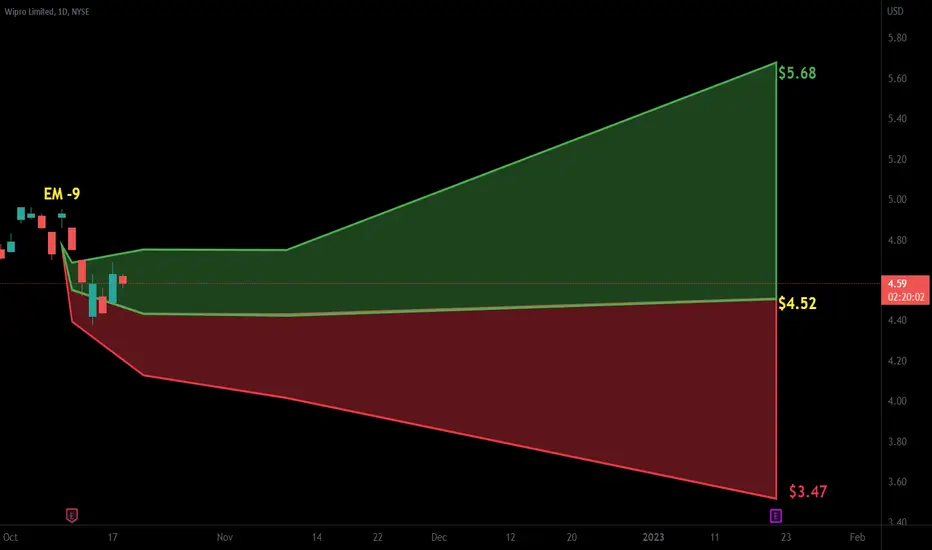
$WIT with a Bearish outlook following its earnings #Stocks The PEAD projected a Bearish outlook for $WIT after a Negative Under reaction following its earnings release placing the stock in drift D with an expected accuracy of 66.67%.
Wipro forming Cup and handle FormCan take a trade above 430 levels for long term
If crossed those levels will give a very good move
#wipro

Wipro bear trap Weekly bull div + three drives forming into HTF 2000s ATH. Perfect setup for a short squeeze to get all the bottom-shorters to get liqd.
(Also my friend who's always been a counter signal just posted a video stating he'd sell his Wipro shares right now if he had any)

WIPRO ANALYSIS!!, 50 MOVING AVERAGE!!WPRO has given a bas returns this year, its quartly results also gave a negative affect on its stock prices. but this are all short term, things.
this stock has pastly given great returns(look at the past trend i have drawn, the returns are approx.. 45% in a year).
long term things are the moving averages, stock is in tis 50 moving average, as shown in its chart. good stock to buy now.

shortAs today Wipro price is 377 but chart pattern showing heavy selling in few day next supporting zone is 302 so anyone want to invest in wipro than 302 is good opportunity to buy for long term and sl at 5% and if anyone want to short then good time to short of target of 302 level

Can we see short covering in WiproWipro looking good at 377 level
buy for target of 530
Looks risky bet but possible

WIPRO BD -10%It is a down trending stock, Today it has been given a BD, it may retest and fall further down.
You can find a short opportunity here.

Wipro Making Extracting Triangle may be touch 396 Wel as per neo wave concept I am seeing the formation for extracting triangle here which is a bearish formation once confirmed and take entry with Sl of 410.

WiproWipro CMP 394
Inverse Head and shoulder in making...
above neck line ..
One can see 20+points as tgt ...
Vedang :)
Chart is for study purpose only!!!

Wipro formed Spinning Candle at weekly supportWipro has been respecting the 400- 385 zone for the past many weeks.
And this week, it formed a spinning pattern at the same support zone.
Now the chances are high that above 400 levels, it could test 420-430 levels in no time.
On the hourly timeframe, we could see price forming double bottom formation, now sustaining 392, it could move toward 400 levels initially.
400 level may act as temporary resistance and any breakout above this level, the stock would most likely be moving towards 420-430 levels.

wipro1 day timeframe may it can support here can give some reversal and it is high chance not ggod but may give some upper side moment. or it breaks support zone and touch the next support zone which are indicating in the chart. let's see what chart will reacct....

WiproWipro is totaaly bearish it cant go up until it breaks the fibbo 0.5 level with high volume until it may can touch 2021's low. or can spent some time here. in recent bull rally it can't go up so what we can except from this stock ??? it can break 2022 low as of my think

Wipro viewWipro trading at a very crucial support if Wipro broke the level of 400 then we may see a head shoulder pattern breakdown in downside. Our target will be approx. 370 - 360. Chart showing a head and shoulder pattern on daily chart. Hope you this will help you in analysing the chart.

Buy zone 345-360 - Stop loss 325 below Buy zone 345-360 - Stop loss 325 below- Positional buy- Only for longtime.

My view on #WIPRO#Wipro ltd is now at the support levels.
Now it may consolidated for some time, then make up side move for 449, 456 and 496.
First support level is 399.70 & Second support level is 381.10.
Note: This is my personal analysis, only for learning.
