BNB - LONG SET-UPBINANCE:BNBUSDT
bnb Looking good to long between 770 -- 790
SL Below 740 (Accordingly)
Lev & Margin as per your risk capacity
BNBUSDT trade ideas

BNB is looking strong to reach $900 region (+25%) BNB is breaking a huge resistance with a monthly candle and could reach the fibonacci 1:1 extension at $900 (+25%) region soon. Very strong momentum for BNB continues to reach higher prices, if the weekly candle could stays above $723 will be a great sign for BNB increase its price at least (+25%).

BNB Strong Resistance Meets Whales Sell Orders – A Good Short BNB Current Market Update
The coin is now trading at its All-Time High , facing a very strong resistance around $900 .
This presents a great short opportunity .
After carefully monitoring buy and sell orders on-chain, I noticed a strong confirmation for the short setup:
Whales and Market Makers sell orders are clustered heavily around the $888 – $890 resistance zone.
✅ My Personal Strategy:
Short Entry: Resistance zone between $888 – $890
🎯 Target 1: $876
🎯 Target 2: $873
Please note:
This is not financial advice – I’m only sharing my personal trades.
Always do your own research before taking action.
👍 Don’t forget to like if you found this useful, and feel free to follow me for more analysis of this kind.
Best of luck 🌹

BNBUSDT | Sell Setup | 09 Sep 2025 – 08:20 EDTBNBUSDT | Sell Setup | 09 Sep 2025 – 08:20 EDT
Buy Zone: 885– 881
Sell Zone: 877 – 871
Scenario : Sell
Entry: 876
Stop Loss: 885
Targets:
TP1 → 872-870
TP2 → 845
Analysis:
From Sell Zone (877 – 871) creates possibilities for a sell move.
Stay alert on updates here.
⚠️ Disclaimer: This idea is shared for educational purposes only and should not be considered financial advice. Please do your own analysis before making trading decisions.
BINANCE:BNBUSDT_PREMIUM CRYPTO:BNBUSD CRYPTOCAP:BNB DELTAIN:BNBUSD.P DELTA:BNBUSDT.P

BNBUSDTI see a divergence on a daily time frame for BNB.
Lower prices are expected for the upcoming weeks.


Bnb long to 855Just recently opened a long on bnb. Still good enough for a 1:1 to $855 area
Sl: 847.42 or lower

BNB/USDT 4H chart1. Trend
• There is a clear yellow inheritance trend on the chart - the price has been moving under it for a long time.
• Currently, the course is testing this line - that is, we are at which it is possible to either break up the mountain or another reflection down.
⸻
2. Key levels
• Resistance resistance:
• 856 USDT (SMA - green line, short -term resistance).
• 865 USDT (last local peak, additional psychological resistance).
• Support (Support):
• 849 USDT (red SMA #1).
• 843 USDT (horizontal support).
• 835 USDT (stronger support, marked in red).
⸻
3. Indicators
• SMA - the price is between short -term (red) and medium -term (green) average walking. This is a consolidation signal.
• MacD - the blue line pierces the orange from the bottom, the histogram begins to shine green → a sign of potential growth.
• RSI - around 45–50 → neutral, shows neither a sale nor buying out. It indicates the possibility of both directions.
⸻
4. Possible scenarios
• bullish (upward):
• If the price stands out above 856–865 USDT and persists, a possible level of 880 USDT levels.
• Confirmation will be further strengthening MacD and RSI going towards 60+.
• Bear (inheritance):
• If the course is rejected from the trend line, the decline may go down to 843 USDT first, and in case of puncture - up to 835 USDT.
• RSI Congress below 40 and MacD reversing down will confirm their weakness.
⸻
✅ Summary:
BNB is now in the decision zone - it tests the downward trend line and key resistance at 856–865 USDT. MacD suggests that bulls are trying to take the initiative, but RSI is still neutral. If the mountain is broken, the movement can be dynamic. If rejection - descent to 835 USDT very real.

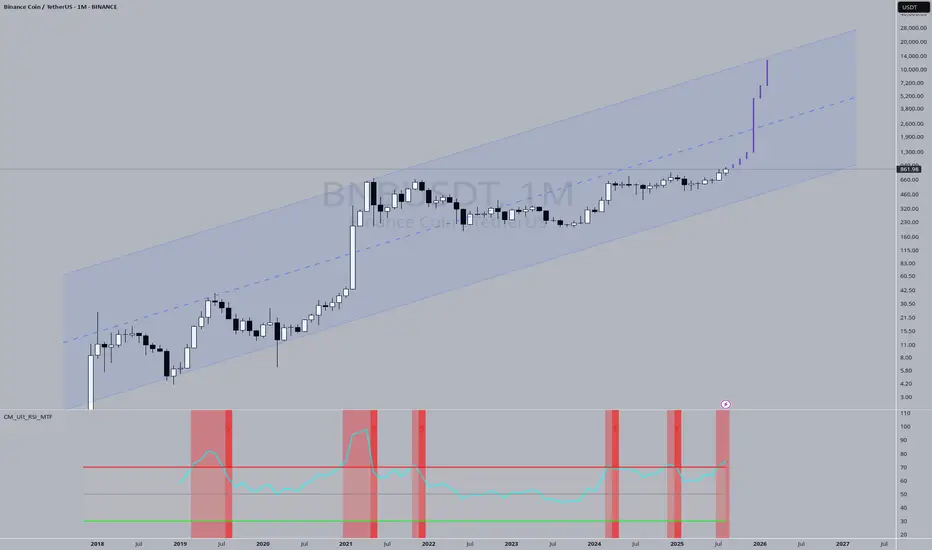
BNB weeklyBNB is in an uptrend on the weekly timeframe and has broken above the key $700 resistance.
However, a bearish divergence on the MACD signals a potential correction.
Key support: $700 – Next resistance: $1,100.
Overall trend remains bullish, but a pullback may occur before further upside.

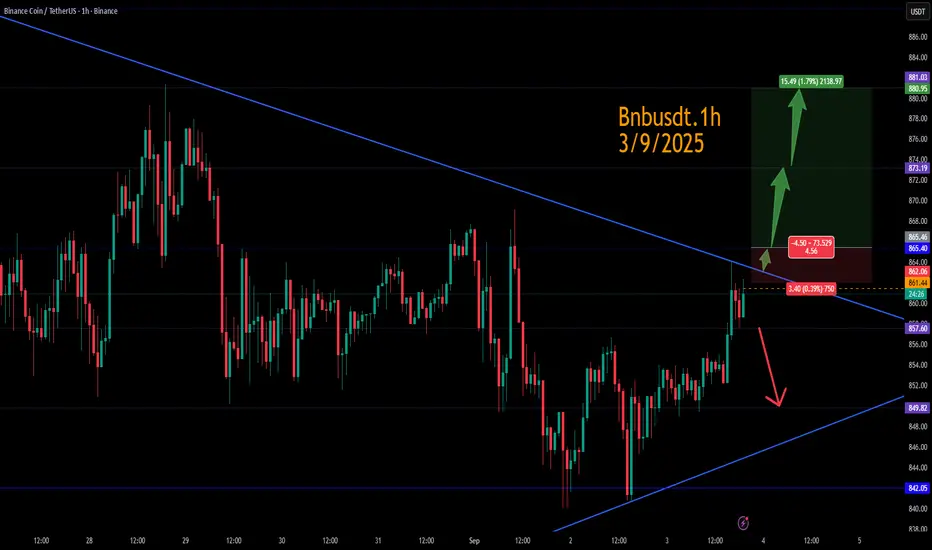
bnbusdt.1hAnalysis of the bnbusdt pair on the hourly timeframe.
The analysis is based on trend analysis, support and resistance levels, and price action.
The strongest scenario is an upward trend, provided the trend is correctly broken.
Short term Trade Sell BNB at 848$ Sell BNB. BNB (Binance Coin) will plunge to $ 825 from it's current price of 848 $. You can book profit as per your desire.

Possible SHORT on BNBUSDTSo, BNBUSDT just broke out of a minor Bullish Counter Trendline, so now we expect a SELL.

btcusdtTrading Decision
Direction: Cautiously Long (targeting R1/R2).
Entry Zone: 112200 - 112500 USDT (near S1/MA20 confluence).
Stop-Loss: 3% below entry (~109000 USDT, just below S3).
Take-Profit:
TP1: 113256 (R1, +0.45%).
TP2: 113885 (R2, +1.0%).
TP3: 114341 (R3, +1.4%).

Binance coin seeks to the $900 ┆ HolderStatBINANCE:BNBUSDT on the 6h chart is forming sideways ranges after its rally. Key support sits at 820–830, while resistance lies at 940. Defending support could trigger another bullish breakout toward new ATH levels.

DeGRAM | BNBUSD held the support level📊 Technical Analysis
● BNB/USD is trending inside an upward channel, with recent price action breaking and retesting the channel boundary, confirming bullish continuation.
● Current structure shows higher lows above 832 support, positioning price for a move toward 936 resistance if momentum sustains.
💡 Fundamental Analysis
● Binance Smart Chain activity has increased with rising DeFi and gaming adoption, while Binance continues expanding regulatory approvals globally, bolstering investor confidence.
✨ Summary
Bullish above 832; targets 900 → 936. Invalidation on a close below 820.
-------------------
Share your opinion in the comments and support the idea with a like. Thanks for your support!

BNB go to ATHBNB is in good shape and if the next candle closes on the 4-hour timeframe, the probability of a ATH is very high.
Be profitable

Binance coin broke through the previous resistance ┆ HolderStatBYBIT:BNBUSDT has broken through previous resistance after months of consolidation and wedge formations. Momentum remains bullish, and with price holding above $800, the next key target sits at $950. The chart structure favors continued gains if buyers maintain control.

BNBUSDT → Strong altcoin. Correction before growth.BINANCE:BNBUSDT.P , after forming an ATH, entered a correction, which may stop at 10-15%, after which the market may enter a recovery phase. The coin looks quite strong, especially against the backdrop of a bullish trend...
BNB looks quite stronger than Bitcoin. While the flagship is forming a deep correction, the altcoin is testing local support within the bullish trend.
BNB has quite positive dynamics. There is a strong bullish trend, the ATH has been updated, but a correction is forming, which is 8% of the permissible 30% (there is still room to move). The liquidity zone of 820-815 may serve as an area of interest. By the time the mirror level and strong area of interest are retested, Bitcoin may move into a recovery phase, which in turn will trigger growth in BNB.
Support levels: 820, 816, 796
Resistance levels: 861, 884, 901
At the moment, the entire cryptocurrency market is in a downtrend. As part of this cycle, BNB may test support at 820-816. A false breakdown of support and consolidation above this level may indicate that bulls are interested in further growth. This could trigger a recovery within the main trend.
Best regards, R. Linda!

BNB Holds Above Range High as Market Eyes $1,000 ExtensionBNB has broken out of its long-term trading range and now faces resistance at the $905 Fibonacci extension. A rejection here, paired with consolidation above the former range high, would be considered bullish for continuation toward $1,000.
After months of ranging, BNB has finally broken free from its long-term consolidation and is testing key Fibonacci extensions. Price action is showing strength on the higher timeframes, with momentum leaning toward further upside as long as support is maintained above the former range high. This breakout comes at a crucial time, where the market as a whole is attempting to establish sustained bullish structures.
Key Technical Points:
- Breakout Confirmed: BNB has broken above its long-term trading range, flipping prior resistance into support.
- Immediate Resistance at $905: Price has stalled at the Fibonacci extension, making this the key short-term hurdle.
- Next Target $1,000: The 0.618 Fibonacci extension of the monthly trend sits at $1,000, representing the next major objective.
Main Analysis:
The breakout above the established trading range has shifted the broader outlook for BNB into a bullish continuation phase. For months, the token traded in a sideways structure, but buyers have now gained the upper hand by forcing a close beyond range highs. This structural shift is significant, as it marks a potential transition from consolidation into an extended bullish trend.
The $905 level is proving to be immediate resistance. This region aligns with the Fibonacci extension of the prior move and is historically a zone where price often pauses. A clean rejection here is not inherently bearish, provided BNB continues to consolidate above the range high. Such price action would indicate acceptance above prior resistance, turning it into support and creating a strong foundation for higher moves.
From a technical perspective, BNB remains in a strong uptrend. Higher highs and higher lows on the monthly timeframe confirm that bullish momentum is intact. The 0.618 Fibonacci extension level at $1,000 is the logical next target once $905 is cleared. Breaking through this extension would signal that the current trend has enough momentum to sustain additional upside.
Volume profile data further supports the bullish bias. Since 2022, overall trading volume has been in decline, yet bursts of bullish volume inflows during key breakout attempts suggest that demand is returning at strategic moments. If this pattern continues, it will likely underpin a larger continuation move that carries BNB beyond the current resistance zone.
What to Expect in the Coming Price Action:
BNB’s ability to hold above the former range high will determine the strength of the current breakout. Sustained consolidation here, followed by a decisive move through $905, would open the door for a push toward the $1,000 Fibonacci extension. Failure to hold above the range high, however, would place the breakout at risk and could trigger a deeper retracement before any new leg higher.

Lingrid | BNBUSDT Buying Opportunity In Consolidation ZoneBINANCE:BNBUSDT is pulling back after hitting the higher high near resistance and is now testing the key support region around 800. The structure shows a downward trendline acting as pressure, while the broader setup still respects the long-term upward channel. A rebound from the current zone would set the stage for a push toward 880 as long as support holds. Momentum remains bullish in the larger channel context despite short-term corrective waves.
📉 Key Levels
Buy trigger: Rebound from 800 support
Buy zone: 800–805
Target: 880
Invalidation: Below 710
💡 Risks
Breakdown below 800 could shift the structure bearish.
Macro-driven volatility from U.S. inflation data or Fed comments.
Strong resistance at 880–930 may cap upside momentum.
If this idea resonates with you or you have your own opinion, traders, hit the comments. I’m excited to read your thoughts!

Short term - Long but long term is ShortThis aint gonna last long buddy but this is the shit of the decade. I love everything about what binance is doing with the people. i hope that it goes up like my shit. however i can see that there will be a chance to short this bitch to a current setup. I hope i am wrong but this aint gonna like my quant. Long live quant

BNB tuched its TPThe first position reached its target with reward 2
Please go and see the previous analysis.
I am waiting for a new high to be recorded
