BNBUSDT trade ideas

analyze BNBif the impulse and correct that i realize will be true the price will take another impulse for a downtrend

TRYOUT PUBLISHING MY VIEWS HERE ON BNBUSDT.P FULL NEW SECRET DAY TRADERS TIP I DISCOVERED, LIVE CHART ANALYSIS
COIN NAME: BNB/USDT.P
RISK: 1:3.48
TAKE PROFIT: 26.59 (3.06 from entry)
STOP LOSS: 27.68 (0.8% from entry)
Hi Trader,
First time here! Great to be here to share a crypto analysis approach i find interesting, check it out. I'M STILL A STUDENT OF THE MARKET
KEY GUIDE: DEMAND & SUPPLY, MARKET STRUCTURE, LIQUIDITY, ORDER BLOCKS, IPA/FVG/IMB
THIS TIP IS NOT FINANCIAL ADVICE, BUT IF YOU FIND THE APPROACH GOOD AND WANT TO GIVE IT RIDE SINCE IT'S A LIVE SESSION RISK 1% OF YOUR CAPITAL

⚡️BNBUSDT CMC TRADING ⚡️ TRIANGLE PATTERNBNBUSDT has formed an hourly triangle pattern, indicating substantial potential for a significant move or rally towards the next 4-hour Order Block (OB). The triangle is characterized by a perfect bullish breakout condition, suggesting the likelihood of a notable internal impulse within the triangle before the eventual breakout.

BNBUSDT LONG ScalpingBNBUSDT LONG
Entry :271.1
Leverage : Cross X75
Capital invested : 2%
Stop Loss : 265.384
Targets : 273.81100000000004

📈 New Bull Rally About To Start👉 After a Breakdown The Ending Diagonal That Happened At The November 21 With Sharp Dump, Currently The #BNB Price Sitting Above The 0.618% Fibonacci Level Which Makes an Important Support ,I Expect a New Bull Rally By Breakout From The 235$ Resistance Area In Near Future
📥Targets Are 260$ And 300$ Areas

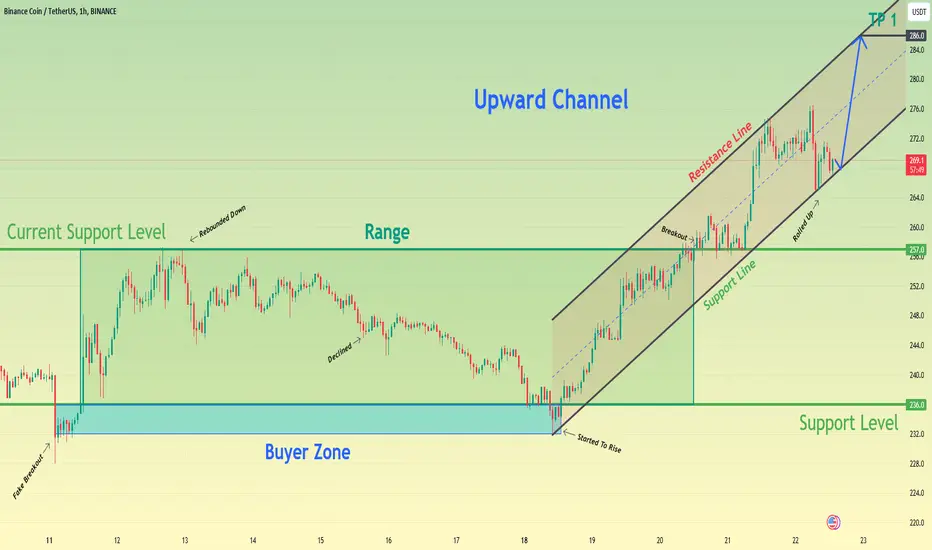
Binance Coin can rebound from support line and start to move upHello traders, I want share with you my opinion about Binance Coin. Looking at the chart, we can see how the price a few moments ago declined below the 236 support level to the buyer zone, where it at once rebounded and rose back, making a fake breakout. Next, the price started to range, in which it firstly rose to the top part, which coincided with the current support level, but soon BNB around down and started to decline. Declined to the buyer zone, the price at once rebounded and started to rise in an upward channel, where in a short time BNB rose back to 257 current support level. After this, the price broke this level and reached the resistance line of the channel, but a not long time ago, BNB rolled down and now it trades near the support line of the upward channel. In my mind, Binance Coin can bounce from the support line and start to rise to the resistance line back. For this case, I set my target at the 286 level, which coincided with this line. Please share this idea with your friends and click Boost 🚀
BNB Bullish ScenarioBNB has broken a long-term resistance trendline and flipped it into support with above average volume.

Binance Coin(BNB): Reached Major Resistance! BNB is currently exhibiting critical price action as it tests a major resistance zone around $260. This level has previously acted as a strong barrier; a decisive breakout above could signal further bullish momentum. However, the price has faced multiple rejections at this level, so let's see.
We have two possible scenarios here:
1) Breakout with a nice re-test, which would confirm this zone to be backed by bulls, and then we will see a nice movement to further upper zones.
2) The price will fail to seize that resistance, leading it to close the daily candle below it and potentially continuing that weakness further down.

BNB 2024Hello friends, today I want to write my analysis of the trend of Binance Coin here. Since the CEO of Binance CZ faced legal problems in the United States court, many people are waiting for the heavy fall of BNB, but the reality is that BNB With the support of Binance exchange, it continues to grow, and in my opinion, many people can become rich by buying and holding BNB in the new year. Fundamentally, BNB is one of the main heavyweights of the crypto market, which reminds me of Ethereum 200. Throws dollars. My expectation is that it will grow up to 2700 dollars this year, although it has much more potential. Have a happy and profitable new year

BNB CUP & HANDLE PATTERN BULLISHSnap shot of Cup & Handle Pattern on BNB
Bullish Possible targets $300

$BNB performing bullish descending triangle in 1week ** CRYPTOCAP:BNB performing bullish descending triangle in 1week **
Trading a bullish descending triangle involves identifying a specific chart pattern and implementing a strategy based on the expected price movement. The descending triangle is a continuation pattern that usually forms in an uptrend and suggests a potential continuation of the bullish trend. Here are the steps you can follow:
1. **Identify the Bullish Descending Triangle:**
- Look for a strong uptrend in the price of an asset.
- Identify a descending triangle pattern, which is formed by a horizontal support line and a descending trendline connecting lower highs.
2. **Confirmation of the Pattern:**
- Ensure that the price has touched the support line at least twice and the descending trendline has been established with lower highs.
3. **Entry Point:**
- Consider entering a long (buy) position when the price breaks above the descending trendline. This breakout is a signal that bullish momentum may continue.
4. **Volume Confirmation:**
- Confirm the breakout with an increase in trading volume. Higher volume during the breakout can indicate stronger market participation and validate the bullish move.
5. **Stop-Loss Placement:**
- Place a stop-loss order below the support line. This level is crucial, as a break below it could signal a potential trend reversal.
6. **Take Profit Target:**
- Set a profit target based on the height of the triangle. Measure the distance from the highest point of the triangle to the support line and project that distance upward from the breakout point. This provides a potential target for the bullish move.
7. **Risk Management:**
- Manage your risk by adhering to proper risk-reward ratios. This involves ensuring that the potential profit is greater than the potential loss.
8. **Monitoring the Trade:**
- Keep a close eye on the trade as it progresses. If the price moves in the anticipated direction, consider adjusting your stop-loss to lock in profits or trailing it along with the ascending support line.
Remember that trading always involves risks, and it's crucial to use risk management strategies, such as setting stop-loss orders and not risking more than a small percentage of your trading capital on a single trade. Additionally, technical analysis should be complemented with other forms of analysis, such as fundamental analysis and market sentiment, for a more comprehensive view of the market.

BNB Bullish ☀️ Ahead - Going Upwards! BTC ☀️, ETH 🌧️A bullish sun ☀️ will shine over Bitcoin, Ripple’s XRP, Binance Coin, and Avalanche in the next 24 hours, while bearish clouds will sweep over Ether and Cardano. ☁️
These mixed trading signals will continue to prevail in the next seven days, with Bitcoin set to continue rising, and Ether facing downside pressure. 🌧️
Follow us for more crypto weather reports!

BNB: Approaching ResistanceTrade setup : Trends are mixed. Following a bullish breakout from Sideways Channel, price reached our target of $260, where it got rejected in Nov and July.
Swing Traders: Pullbacks near $220 support area could be an attractive swing trade entry, with upside back to $260 near-term. That $220 level was previously a resistance area, which was broken and turned into support area (concept known as polarity).
Trend Traders: If price breaks above $260 resistance zone, it could revisit $300 next.
Trend : Uptrend across all time horizons (Short- Medium- and Long-Term).
Momentum is Bullish (MACD Line is above MACD Signal Line and RSI is above 55).
Support and Resistance : Nearest Support Zone is $220 (previous resistance), then $200. The nearest Resistance Zone is $260, then $300.

BNBUSDT - After strong impulse up, price can start correctionHi guys, this is my overview for BNBUSDT, feel free to check it and write your feedback in comments👊
Some days ago price bounced from mirror line and in a short time it rose to resistance level, thereby breaking $228 level.
Next, price corrected to this line and even declined below, but soon it made upward impulse higher than $255
But soon, BNB around down and fell back to support level, breaking resistance level and mirror line.
After this, price entered to rising channel, where it some time traded near support level and then rose back to resistance level.
Recently BNB was little corrected and after this, price made strong upward impulse higher than resistance level, exiting from channel too.
I think Binance Coin, after strong impulse, can start to decline to $255 support level.
If this post is useful to you, you can support me with like/boost and advice in comments❤️

BNBUSDTtrade idea on bnbusdt, taking entry after price takes out inducement targeting the previous swing high for take profit and the swing low of the structure below the inducement for stoloss

BNB growth after launchpool announcementI invite you to discuss the BNB chart on a four-hour interval. As we can see, the price has broken our yellow downtrend line with dynamic upward movements that are associated with the newly announced Lanchpool on the Binance exchange.
Due to the sudden increases after unfolding the trend based fib extension grid, we see that the price is fighting a strong resistance at $261, only when the price overcomes it will the path towards the next resistance at $279 open.
Looking the other way, we have visible support at the level of $252, then there is a visible support zone from $242 to $236, while a break from the bottom may result in a drop to the support level at $220.
When we turn on the EMA Cross 50 and 200 indicator, we will see confirmation of the return to the upward trend.
On the RSI indicator, we have approached the upper limit, which reduces the room for growth, while on the STOCH indicator, we are moving above the upper limit, which may result in a rebound in the coming hours.


BNB shows potential for a 60% moveHey everyone,
After a relatively long time of having no activity here, I've resumed sharing my ideas here.
There's potential for an upward move in #BNB if it successfully breaches and maintains its position above the white line.
I've already opened a #long position. Let's observe its progress.
Cheers!
Mr. Cryptotracker

BNBUSDT IDEAFinally Successfully Breakout In WEEKLY Timeframe Chart
Looking Forward To a Massive Bullish Wave

🌟🔍 Binance Coin (BNB) and Its Market Influence 📈💡
🔑 Critical Resistance at $255.7: The resistance level of $255.7 for BNB is crucial for the entire crypto market. A breakout and consolidation above this level could signify restored confidence in Binance and potentially help the market move past the FUD surrounding its former CEO, CZ.
📈 Futures Trading on Breakout: If BNB breaks this level, it could be a signal to open a long position in futures. However, tailor your stop-loss size according to your personal strategy.
🛒 Buying and Holding Strategy: As indicated on the chart, a safe stop-loss for buying and holding BNB would be below $205.
🌊 BNB's Market Impact: BNB's movement could be pivotal in triggering another bullish wave across the broader market, so it's advisable to keep an eye on other cryptocurrencies as well.
🔑 Related Categories:
Binance Coin (BNB) Analysis
Market Impact and Confidence
Entry and Exit Strategies
📣 How do you view BNB's potential impact on the wider crypto market? Are you considering any positions in BNB or other cryptocurrencies? Share your plans and thoughts! 💬🌐 #BNBMarketImpact #CryptoInvestment #TradeCityPro
📚 Remember: Cryptocurrency trading involves risks. It's crucial to stay informed and approach trading with a clear strategy and risk management plan! 🧠💼

BNB UnleashedDon’t Miss Out! Binance Coin (BNB) Leads Crypto Market Charge with Technical Breakout Fueling Potential Surge
Binance Coin (BNB) Price Analysis: Navigating the Path to Surge Towards $300
In the ever-evolving landscape of the cryptocurrency market, Binance Coin (BNB) stands out as a beacon of potential, with its current trajectory indicating a probable climb of up to 20% towards the coveted $300 mark. This analysis delves into the nuanced factors driving BNB’s recent surge, the strategic levels to watch, and the overall market sentiment that could influence its journey.
Binance Coin Price Overview: Catalysts and Momentum
Binance Coin has emerged as a standout performer in the recent crypto market dynamics, particularly as Bitcoin reaches $42,599 and Ethereum soars to $2,204. Amidst this bullish backdrop, BNB has exhibited notable gains, currently resting at $254. The market’s growing optimism, fueled by the anticipation of BTC spot exchange-traded funds (ETFs) approval in January, has become a driving force behind the surge in various cryptocurrencies.
However, the crypto space remains on edge due to the lingering uncertainty surrounding potential pre-approval sell-offs or rallies. In this context, Binance Coin appears to be charting a course of least resistance, paving the way for potential upward movements.
BNB’s Path to $300: Technical Analysis
As we dissect the technical aspects of Binance Coin’s recent performance, it becomes evident that the coin is in the early stages of a compelling rally with a target set at $300. Key indicators underscore the positive trajectory:
Exponential Moving Averages (EMAs):
BNB has maintained its position above crucial levels, as indicated by three applied MAs. The 50-day Exponential Moving Average (EMA) in blue, currently at $237, serves as foundational support. Additionally, the confluence support created by the 21-day EMA (in green) and the 200-day EMA (in white) adds further strength to BNB’s position.
Trendline Breakout
A pivotal moment in BNB’s recent journey was the breakout from the descending trendline resistance. This breakout, coupled with a spring from the horizontal ray support backed by the 50-day EMA, accentuates the bullish theory surrounding Binance Coin.
Yellow Resistance Breakthrough
The next breakout, anticipated above the yellow band on the chart, could be a game-changer. A successful retest of this yellow resistance may pave the way for BNB to surge towards the $300 milestone.
Market Sentiment and Considerations
With BNB’s trajectory pointing towards potential gains, traders need to exercise strategic considerations. As the coin makes strides towards the $300 target before 2024, cautious optimism is advised. Traders should be vigilant, considering potential obstacles at $260 and $280, which might pose challenges during the ascent.
In conclusion, Binance Coin’s ascent in the crypto market reflects not only its individual strength but also the broader positive sentiment prevailing in the space. The journey towards a climb to $300 holds promise, and strategic awareness of key levels will be instrumental for traders looking to capitalize on BNB’s upward momentum. As BNB continues its climb, the crypto community watches with anticipation to see if it can conquer the challenges and emerge triumphant in the ongoing crypto rally.

BNB tunnels 2023/24I've been trading this for some time, think it's valid for the next months.
Long live rock'n'roll
