BNBUSDT trade ideas

BNB/USDT 1H Interval ReviewHello everyone, let's take a look at the BNB to USDT chart taking into account the one hour time frame. As you can see, the price is moving above the local downtrend line.
After unfolding the Fib Retracement grid, we will mark a support zone from $224 to $221, while we still have support at $218.
Looking the other way, you can see that the price has moved back through the resistance zone from $230 to $234, and then we have resistance at $238.
Looking at the CHOP indicator, we can see that there is still some energy left for a move, on the RSI indicator, despite the recovery, there is still room for a decline, and on the STOCH indicator, we have room for the price to go lower.


Keeping an eye on #BNB/USDT Trendline and resistance zone in 1-HKeeping an eye on #BNB/USDT Trendline and resistance zone in 1-Hour TF!
CRYPTOCAP:BNB needs to clear the Previous High $228.45 to gain the bullish momentum. Wait or BO/retest above that level to gain the bullish momentum.
#BNBUSDT is holding PMH $221.6 level as a strong support.


BNBUSDT.P-IN BEARISH TRENDBNBUSDT.P is in a bearish trend and start printing new LLs and LHs, price was bullish put we found an bearish divergence on rsi, price make symetrical triangle and breakdown and we will take entry on retest of the triangle, what do you guys think? let me know,

FTX 2.0?This chart looks eerily similar to the FTTUSDT one. The head and shoulders and the bearish retest aren't helping either.

Time to make a short on BNBHi, so sorry about previous forecast of BNB price. Too many events have made changes in the past few weeks.
Observe the bulls rejected 3 times at the key price of 338. I see that BNB is likely to move around 250-260 USD/token. Now time to make a short.
Good luck!

BNB seems ready to goo forward if the bitcoin still bullishBNB find their Bullish way after a long consolidation time, Now is ready to move up if the bitcoin still bullish

$BNB-4reclaimed $220 by the looks of it , invalidation below yellow line for swing
perps your call .. $216.49 should be decent enough
targeting blue line above

📈📊 #ChartPattern Alert! 📈📊 📈 Falling Wedge 📈📈 What is a Falling Wedge? The Falling Wedge is a bullish chart pattern characterized by two converging trendlines, with the lower trendline sloping upward more than the upper trendline. It typically signals a potential bullish reversal, with the price likely to break upward after the wedge pattern.
📈 How to Identify:
Draw a trendline connecting at least two higher highs (upper trendline).
Draw another trendline connecting at least two higher lows (lower trendline).
📈 What it Signals: The Falling Wedge suggests a potential bullish reversal, with buyers gaining strength as the price reaches higher lows within the wedge. It often forms during downtrends and can precede a significant price move to the upside.
📈 Trade Strategy:
Consider buying when the price breaks above the upper trendline of the Falling Wedge.
Set profit targets based on the pattern's height added to the breakout point.
Implement a stop-loss to manage risk in case of a false breakout.
Remember to validate your analysis with other technical indicators and conduct thorough research before making any trading decisions. Happy charting and trading! 📈💹

BNB 4HInterval Review ChartHello everyone, let's take a look at the BNB to USDT chart on a 4-hour time frame. As you can see, the price is moving above the local uptrend line.
After unfolding the Fib Retracement grid, you can see that the price is moving above the support zone from $212.5 to $210.5, then there is support at $208.5, and then a strong support zone from $205.6 to $201.9.
Looking the other way, you can see that the price is trying to attack the strong resistance zone from $214 to $217.4, when it manages to overcome it, we still have resistance at $221.6.
Looking at the CHOP indicator, we can see that the energy is slowly starting to grow, on the RSI we are moving in the upper part of the range, but looking at the STOCH indicator, we can see that the rebound took place to the middle of the range and resulted in another rebound, which slightly limited the space for a new price increase.

BNB SHORT SIGNAL 15MINHello dear traders
I came with a short-term short signal in the BNB currency in the 15-minute time frame.
Entry point, loss limit and profit limit are shown in the picture.
In the specified area, we will expect a price reaction in the direction of shorts.
Thank you for your support

BNB : and now ?Hello.
We have a big problem on BNB.
• Since the low in december, BTC increase of 100%.
• Since the low in december, BNB increase of 0%.
Major trend support is broken. A possible retest exist but BTC need to pump a lot for it.
On the chart, you have all the information.
• The actually support trend have to hold otherwise, we are going to another important dump.
• The actually resistance trend should be reject BNB. If not : New uptrend. But i do'nt believe it for the moment.
Keep the eyes of the resistance trend.
Today, BNB gain the Ma50 Daily, the last time, we had a rejection. Don't forget the cross Ma50 and Ma200, we are in bear zone.
The last support is the last chance to BNB (140$) to hold it, otherwise ... Market is going completely destroy. Remember FTX.

BNB/USDT 4HInterval Review ChartHello everyone, I invite you to review the chart of BNB in pair with USDT, on a four-hour interval. First of all, we can use the blue lines to mark the upward trend channel in which the price is currently trying to go above it for the second time.
Now let's move on to marking the support places. We will use the Fib Retracement tool to mark supports, and here we can see a strong support zone from $208.5 to $205.7, but when we fall lower, the next support is at $202.
Looking the other way, we can similarly mark places where the price should encounter resistance on the way up. And here the price was rejected by the resistance zone from $214.6 to $218.5, and then we have a second strong zone from $222 to $228.
The CHOP Index indicates that most of the energy has been used. The RSI indicator shows that we approached the upper limit, which resulted in a price recovery, similarly the STOCH indicator began to reverse after approaching the upper limit and it is clear that there is room for the price to go lower.

#BNBUSDT #LQR #TOBTC #LaqiraProtocolThe price is in the Bullish channel Due to the strength of the Bullish candles , if the price comes to the scalpe Level of one hour, you can open long trade after confirmation and matching with bitcoin levels. If you do not approve in the level of the scalpe in certain 4-hour Levels , you can trade after confirmation. This analysis is a personal view and the offer is not buy or sell

BNB Macro ViewLooking at price action since May 2021's high, we could be close to the end of the descending cycle.
We have already reached 100% extension of gray A-B, which is a very common condition of Wave C.
In my primary count, we are currently in black wave 5, which would give us a new low below 183.4.

I took this position as a papper tradeI took this position depends on the reason where wrote at the down👇
-Price taking 4H/1D's swing low liq
-price making range low deviation
-price giving re-test at the range low
-There was 4H imbalance that could be a good target
NOTICE: I DIDN'T TOOK LAST HIGH WICK'S AS A LIQ BECAUSE THAT HIGH TOOK LAST 1-2 HIGH'S LIQ

The best range to accumulate #BNBOver the course of a whopping 970 days, #BNB has been traversing within the boundaries of a triangle pattern, as observed on the two-day time frame. Currently, it finds itself in close proximity to the lower support of this pattern. It's worth noting that whenever #BNB has touched this lower support in the past, it has displayed a propensity to rebound.
In my assessment, an ideal range for embracing #BNB lies within the vicinity of $180 to $210. This zone holds promise and could pave the way for intriguing opportunities in the crypto realm.
The world of cryptocurrency is brimming with anticipation, ready to explore what lies ahead in this captivating journey!
In the 12-hour time frame, #BNB has made an impressive move by breaking free from a falling wedge pattern. The current phase involves a retest of this breakout zone, a critical moment in the journey.
Adding to the intrigue, the RSI indicator is painting a compelling picture with a bullish divergence in the 12-hour time frame.
Based on the technical patterns at play, there's reason to anticipate a potential 30% bounce from this juncture. The cryptocurrency world is filled with excitement as we await the unfolding of this promising chapter!
This chart is likely to help you make better trade decisions if it does consider upvoting it.
I would also love to know your charts and views in the comment section.
Thank you

BNBUSDT Long into resistanceLooking at the chart. price gas retraced to a key level abd i am now looking at a nice long position

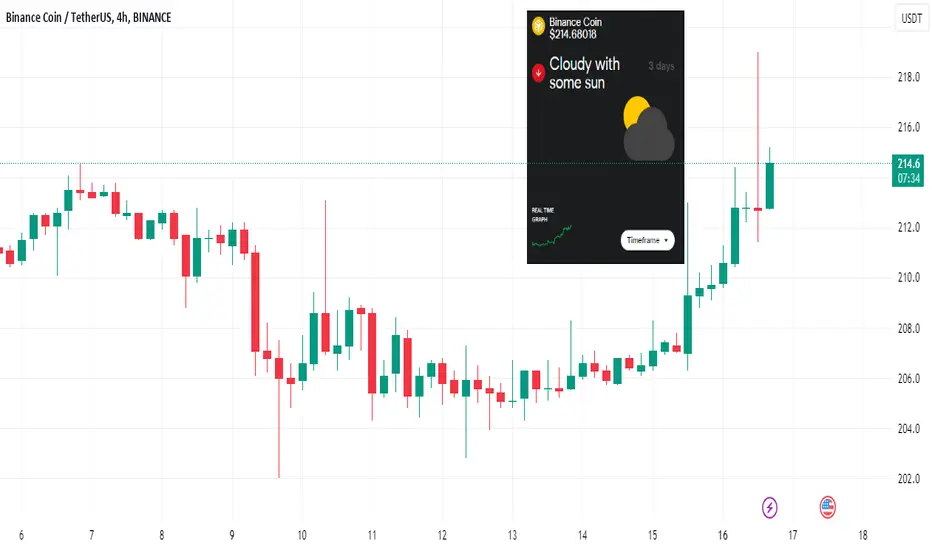
BNB ☁️ Downtrend for the next 3 days? Mixed trading conditions ahead for the global crypto market, with Bitcoin, Ripple, and Binance Coin facing slightly bearish clouds in the next 24 hours. ☁️ BNB downtrend continues for the next 72 hours.
Ether, Cardano, Avalanche, and Dogecoin bask in slightly bullish sun. ☀️ However, Litecoin and Polkadot endure the crypto storm 🌧️, signaling a very bearish market with downside risk.
Over a one-week horizon, the outlook remains cloudy ☁️ and rainy 🌧️ for most cryptocurrencies, with Bitcoin and Polygon as the exceptions. They should both enjoy a slightly bullish sun ☀️, indicating an upside potential.
Follow us for more crypto weather reports!
BNBUSD ❕ reboundThe asset broke up through 200EMA (4H TF)
50EMA crossed up through 200EMA (1H TF)
I expect the upside to continue.

BNB/USDT 4HInterval ReviewHello everyone, let's take a look at the BNB to USDT chart on a 4-hour time frame. As you can see, the price tried to break above the local upward trend line, but quickly returned below it.
After unfolding the trend based fib extension grid, we can see that we have a support zone from $207 to $204, then support at $201 and then at $199.
Looking the other way, you can see that we are in the resistance zone from $209 to $211, and then we have a second zone from $213 to $217.
Looking at the CHOP indicator, we see that most of the energy is exhausted, on the RSI indicator we are approaching the upper limit, which may reverse the price movement, and on the STOCH indicator we are also approaching the upper limit, which resulted in a deceleration of growth.
