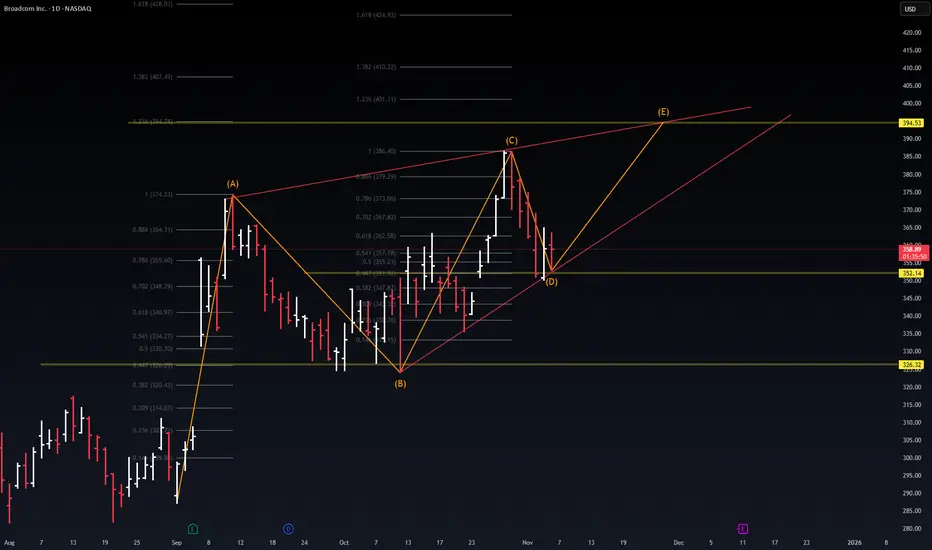
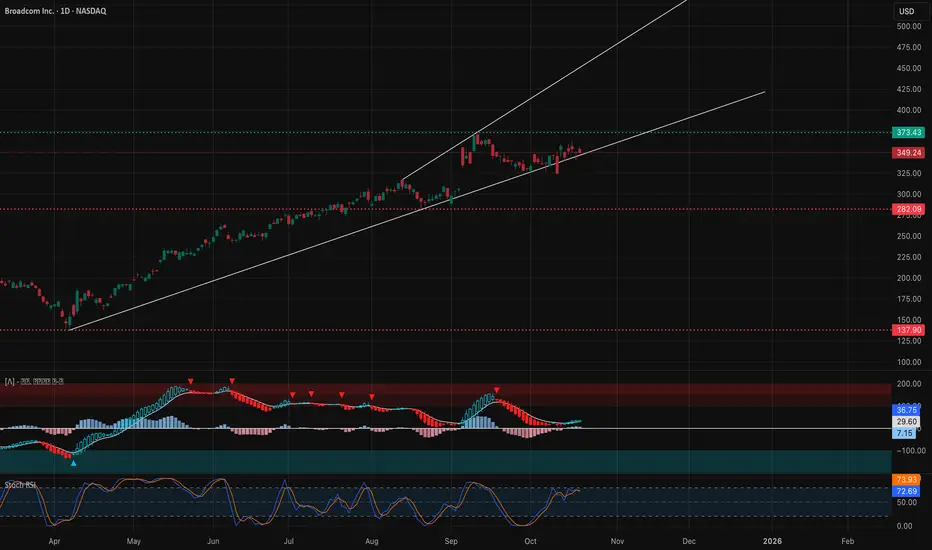
$AVGO — Harmonic Completion Loading (Wave E Setup)⚙️ NASDAQ:AVGO — Harmonic Completion Loading (Wave E Setup)
Date: Nov 6 2025 | Current Price: ≈ $358.84
Structure Insight: NASDAQ:AVGO has completed an A–B–C–D corrective cycle, stabilizing near the 0.618 retracement ($357–358 zone) — a historically strong reversal pocket.
Projection Path: If
Next report date
—
Report period
—
EPS estimate
—
Revenue estimate
—
4.03 USD
5.89 B USD
51.57 B USD
4.63 B
About Broadcom Inc.
Sector
Industry
CEO
Hock E. Tan
Website
Headquarters
Palo Alto
Founded
1961
ISIN
US11135F1012
FIGI
BBG00KHY5S69
Broadcom Inc. is a global technology company, which designs, develops, and supplies semiconductors and infrastructure software solutions. It operates through the Semiconductor Solutions and Infrastructure Software segments. The Semiconductor Solutions segment refers to product lines and intellectual property licensing. The Infrastructure Software segment relates to mainframe, distributed and cyber security solutions, and the FC SAN business. The company was founded in 1961 and is headquartered in Palo Alto, CA.
Related stocks
Broadcom - Please short this stock now!🔒Broadcom ( NASDAQ:AVGO ) just ended its rally:
🔎Analysis summary:
Over the course of the past couple of months, Broadcom has been rallying substantially. But considering that Broadcom is now retesting the rising channel resistance, a retracement becomes more and more likely. We just have to

TradeUSAsignals RecommendationsAVGO - Long (5% of your portfolio) - Order filled @ 342.50
An up trend controlled by Bias traders with both Time and Price traders against the trend.

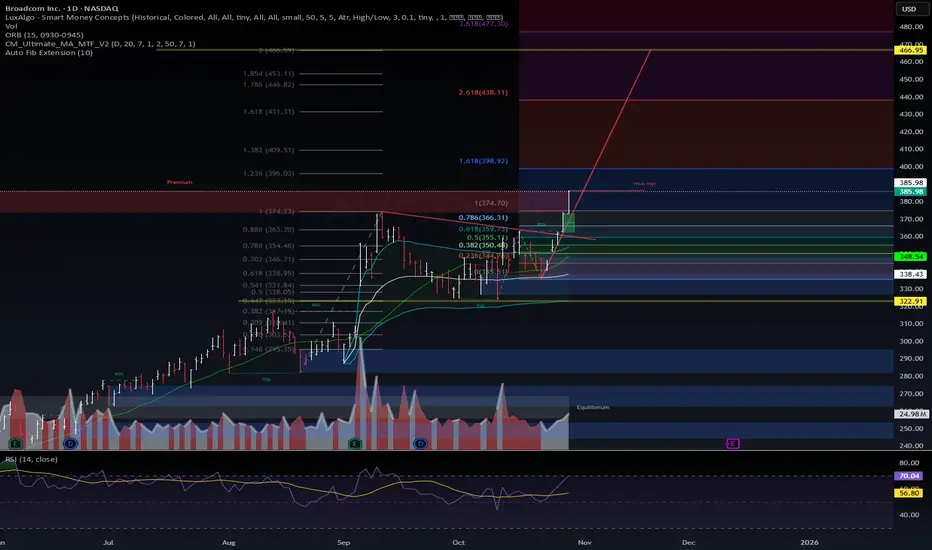
$AVGO | The Chip Vampire Awakes — Liquidity Reversal Complete🩸 NASDAQ:AVGO | The Chip Vampire Awakes — Liquidity Reversal Complete ⚡
Broadcom just reclaimed its premium zone and triggered a macro-level BOS — this is how AI liquidity resurrects after months of compression.
🧠 VolanX DSS Signal Matrix:
✅ BOS confirmed above $360 — smart money continuation d
$AVGO - $400 possibleAVGO - Stock breaking out and hitting all time highs today. Seeing lot of call flow coming in here. Looking for calls above $375 for a move towards $400 and higher. Stock looks decent at the indicator level. Stock has resistance at $380 as well.

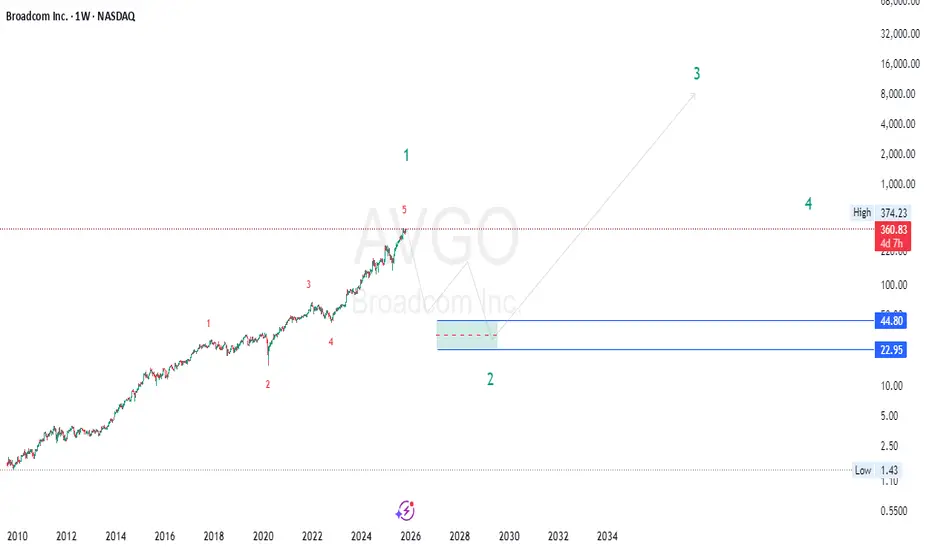
AVGO (Broadcom) Crash Alert | The Biggest Drop Is Just Starting “ AVGO (Broadcom ) is on the brink of a massive correction, with charts pointing toward a potential plunge into the $45–$23 zone — a brutal reset that could shake the entire semiconductor sector before the next bull cycle begins. ⚠️📉”
🔥 Summary:
Broadcom (AVGO) might be entering a massive c
AVGO ShortOn the 15-minute chart for AVGO, the broader market structure has been bullish, with price creating a series of higher highs and higher lows all the way up into the recent peak around $386.46, where a Break of Structure (BOS) was printed. That BOS indicates that price violated a previous swing low,

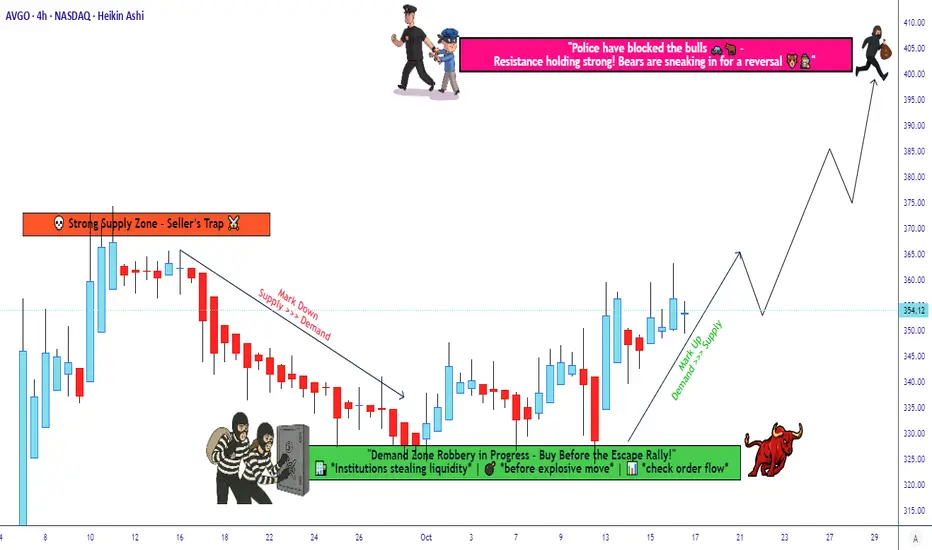
Broadcom Technical Setup - Systematic Entry Approach🎯 AVGO: The Great Heist Setup | Layered Entry Strategy 💰
📊 Asset Overview
Broadcom Inc. (AVGO) - The semiconductor kingpin that's been printing money like a Vegas casino! 🎰
🎭 The Heist Plan: BULLISH Setup
Strategy Style: The "Thief Method" - Layered Limit Orders (Ocean's Eleven style but legal! 😎)
AVGO Weekly Outlook (Oct 21–25): Bulls Defend the Channel Watching for a $373 Breakout 🚀
📆 Daily Chart — Macro Structure and Trend Bias
Market Structure:
Broadcom (AVGO) continues to respect its long-term ascending channel, maintaining higher lows since April. Despite recent consolidation, price remains above the channel midline, signaling that the broade
Broadcom’s the Gap-LoverBroadcom has a very particular behavior, it loves to rally in sharp upward bursts.
It often opens with gaps, quickly pushing the price to new levels. Interestingly, the gap zones are never violated during these uptrends.
However, we’ve recently seen a small but concerning move back into a prev
See all ideas
An aggregate view of professional's ratings.
Neutral
SellBuy
Strong sellStrong buy
Strong sellSellNeutralBuyStrong buy
Neutral
SellBuy
Strong sellStrong buy
Strong sellSellNeutralBuyStrong buy
Neutral
SellBuy
Strong sellStrong buy
Strong sellSellNeutralBuyStrong buy
Displays a symbol's price movements over previous years to identify recurring trends.
Curated watchlists where AVGO is featured.


Frequently Asked Questions
Depending on the exchange, the stock ticker may vary. For instance, on BOATS exchange Broadcom Inc. stocks are traded under the ticker AVGO.
We've gathered analysts' opinions on Broadcom Inc. future price: according to them, AVGO price has a max estimate of 480.00 USD and a min estimate of 300.00 USD. Watch AVGO chart and read a more detailed Broadcom Inc. stock forecast: see what analysts think of Broadcom Inc. and suggest that you do with its stocks.
AVGO reached its all-time high on Oct 30, 2025 with the price of 389.98 USD, and its all-time low was 42.69 USD and was reached on Oct 17, 2022. View more price dynamics on AVGO chart.
See other stocks reaching their highest and lowest prices.
See other stocks reaching their highest and lowest prices.
Yes, you can track Broadcom Inc. financials in yearly and quarterly reports right on TradingView.
Broadcom Inc. is going to release the next earnings report on Dec 11, 2025. Keep track of upcoming events with our Earnings Calendar.
AVGO earnings for the last quarter are 1.69 USD per share, whereas the estimation was 1.66 USD resulting in a 1.69% surprise. The estimated earnings for the next quarter are 1.87 USD per share. See more details about Broadcom Inc. earnings.
Broadcom Inc. revenue for the last quarter amounts to 15.95 B USD, despite the estimated figure of 15.83 B USD. In the next quarter, revenue is expected to reach 17.45 B USD.
AVGO net income for the last quarter is 4.14 B USD, while the quarter before that showed 4.96 B USD of net income which accounts for −16.62% change. Track more Broadcom Inc. financial stats to get the full picture.
Yes, AVGO dividends are paid quarterly. The last dividend per share was 0.59 USD. As of today, Dividend Yield (TTM)% is 0.68%. Tracking Broadcom Inc. dividends might help you take more informed decisions.
Broadcom Inc. dividend yield was 1.25% in 2024, and payout ratio reached 170.61%. The year before the numbers were 2.19% and 55.79% correspondingly. See high-dividend stocks and find more opportunities for your portfolio.
As of Nov 10, 2025, the company has 37 K employees. See our rating of the largest employees — is Broadcom Inc. on this list?
EBITDA measures a company's operating performance, its growth signifies an improvement in the efficiency of a company. Broadcom Inc. EBITDA is 32.72 B USD, and current EBITDA margin is 48.98%. See more stats in Broadcom Inc. financial statements.
Like other stocks, AVGO shares are traded on stock exchanges, e.g. Nasdaq, Nyse, Euronext, and the easiest way to buy them is through an online stock broker. To do this, you need to open an account and follow a broker's procedures, then start trading. You can trade Broadcom Inc. stock right from TradingView charts — choose your broker and connect to your account.