ELI LILLY COMPANY - STOCK REPORTExecutive Summary
Eli Lilly and Company (LLY) has delivered strong revenue and profit growth driven by blockbuster GLP‑1 therapies (Mounjaro, Zepbound) and continued pipeline progress in oncology and cardiometabolic indications. As of 26 Sep 2025 the company shows robust margins, strong free cash
Next report date
—
Report period
—
EPS estimate
—
Revenue estimate
—
15.11 USD
10.59 B USD
45.04 B USD
848.72 M
About Eli Lilly and Company
Sector
Industry
CEO
David A. Ricks
Website
Headquarters
Indianapolis
Founded
1876
ISIN
US5324571083
FIGI
BBG000BNBDC2
Eli Lilly & Co. engages in the discovery, development, manufacture, and sale of pharmaceutical products. The firm's products consist of diabetes, oncology, immunology, neuroscience, and other products and therapies. The company was founded by Eli Lilly in May 1876 and is headquartered in Indianapolis, IN.
Related stocks
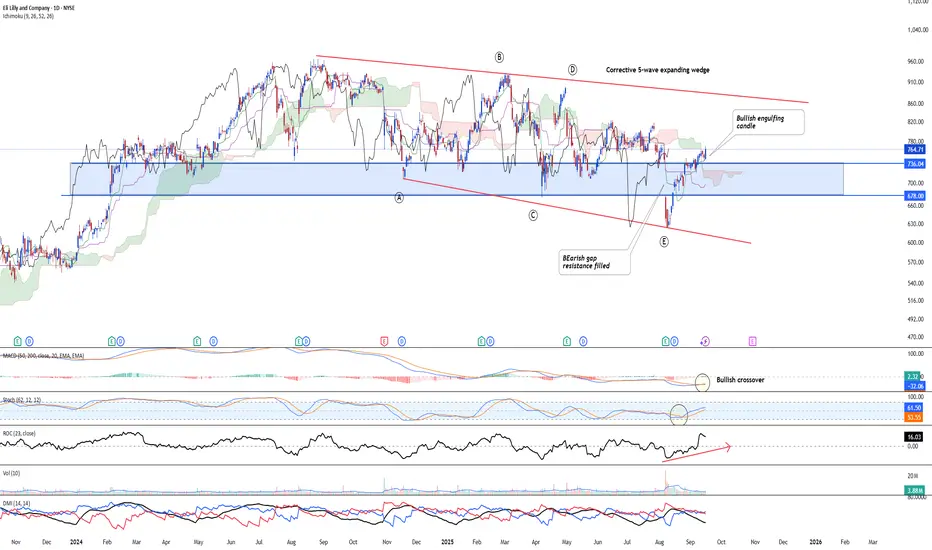
Eli Lily - Complex corrective structure endingNYSE:LLY price action suggest that the stock is likely to complete its extended corrective structure. IF successful, the stock will likely to rally higher as the stock has completed the last leg of the E wave of the 5-wave expanded falling wedge structure.
MACD has perform a crossover at the botto
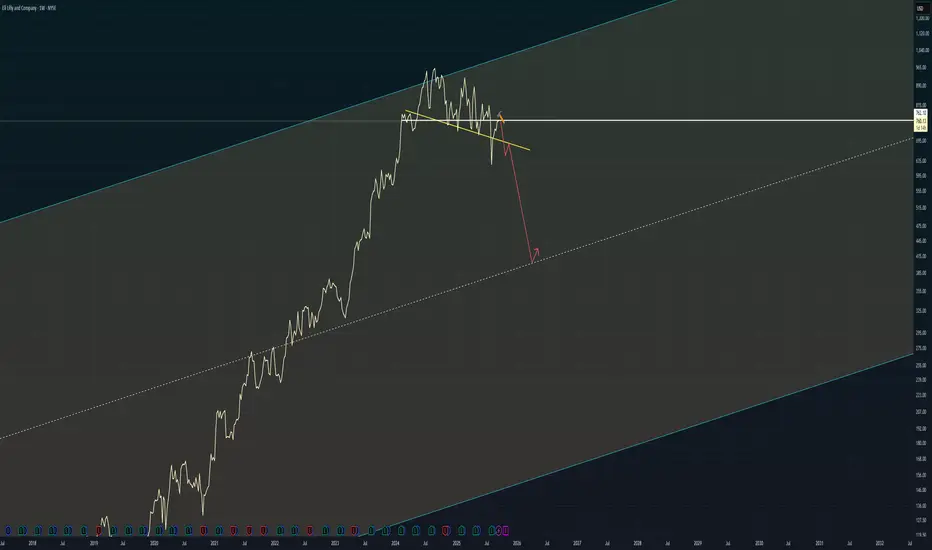
Short LLYHard to tell in this picture, but LLY has reached the top of a massive channel.
Struggling to progress further it's time to seek to the middle of that same channel.
Eli Lilly: Weight-Loss Giant Amid AI Drug Discovery Eli Lilly: Undervalued Weight-Loss Giant Amid AI Drug Discovery and Virginia Jobs Boom Trends? $1050 Target in Sight?
Eli Lilly (LLY) shares are trading at $755.39 today, up 0.45% amid analyst upgrades and fresh headlines on its $2.3 billion Virginia manufacturing plant expansion, creating 650 hig

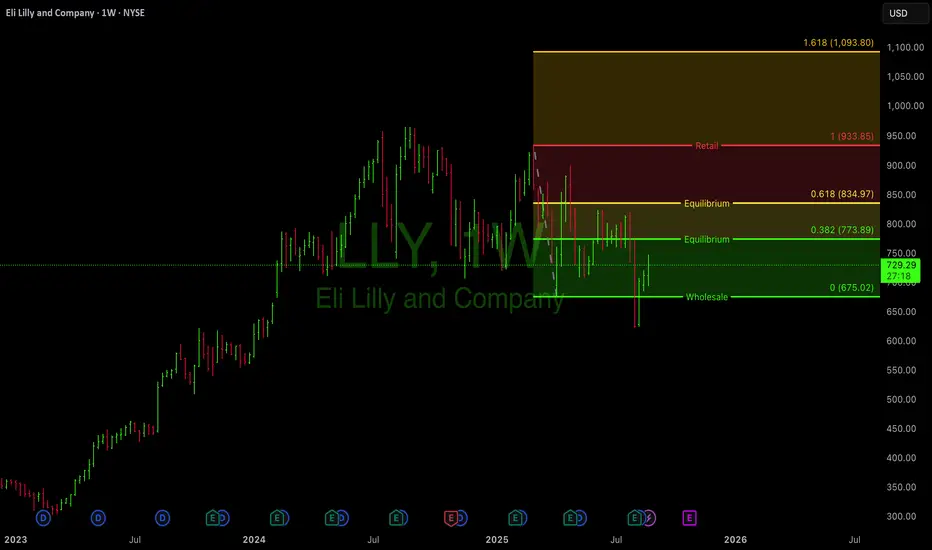
$LLY Trade Levels (Weekly)Entry Zone (Demand): $680 – $700
Stop-Loss: Below $660 (invalidates demand zone)
First Target (Resistance): $800 – $820
Second Target (Supply): $880 – $920
R/R Setup: ~1:3 if entry at demand and target at upper supply
Eli Lilly (LLY) Weekly Chart – Double Top Patterns & Major SuppoLLY has formed consecutive double top patterns within a broad descending channel.
Price recently tested a long-term major support zone and bounced strongly, signaling renewed buying interest. If this momentum holds, a move toward the major resistance near $973 is possible, aligning with the upper

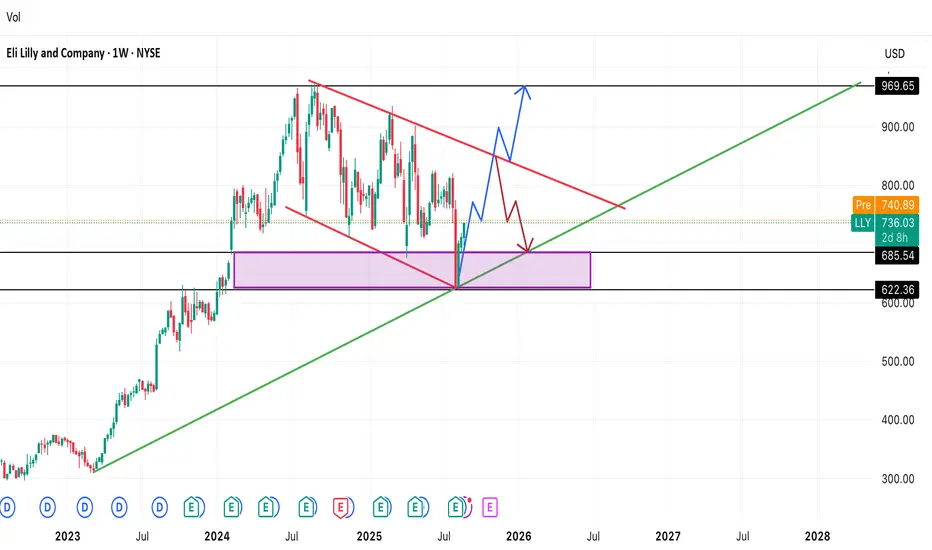
$LLY: Decision Zone — Wedge Breakout or Retest of 685Eli Lilly (LLY) rebounded off the long-term trendline and weekly demand box (≈622–686) and is compressing inside a descending wedge.
Bullish path (blue): a clean break and retest of wedge resistance opens room toward the prior extension/marker near ~970.
Bearish path (red): rejection at the
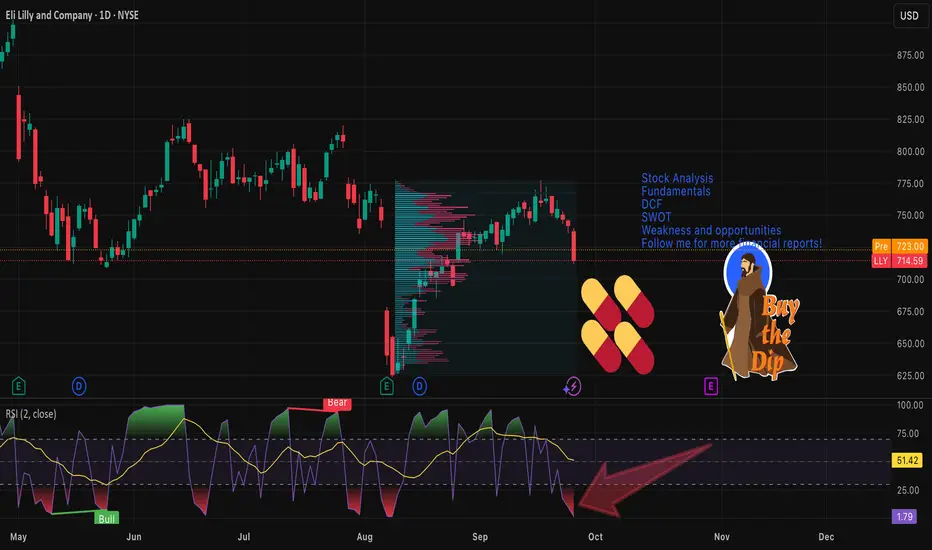
Lilly Has Fallen. Can it Get Up?Eli Lilly has been trending lower, and some traders may see further downside risk in the pharma giant.
The first pattern on today’s chart is the bearish gap on August 7. The decline came despite better-than-expected quarterly results, which may reflect weakening fundamentals.
Second is the May 23

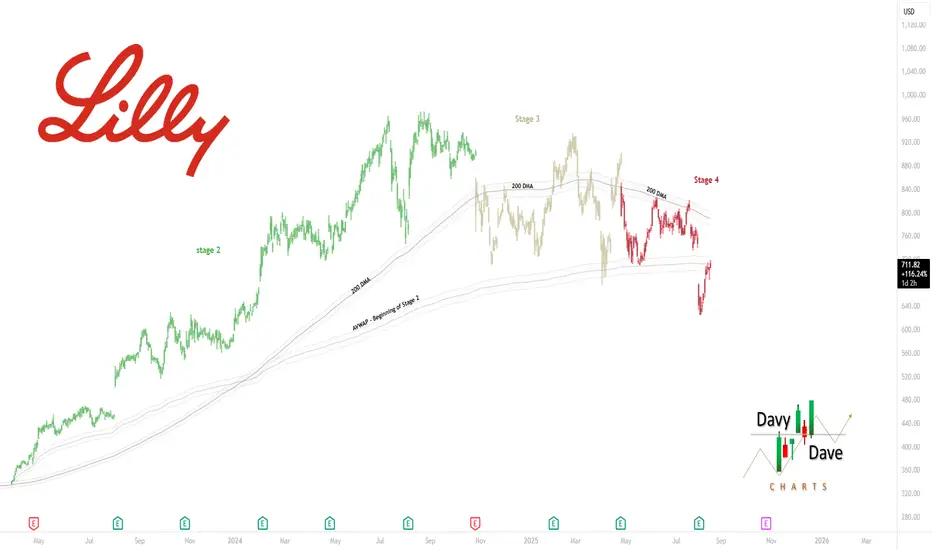
Still in Mark-Down stageBelow the 200 DMA and the VWAP anchored to the stage 2 mark-up start. I don't think we're at the accumulation stage yet. Not even close.
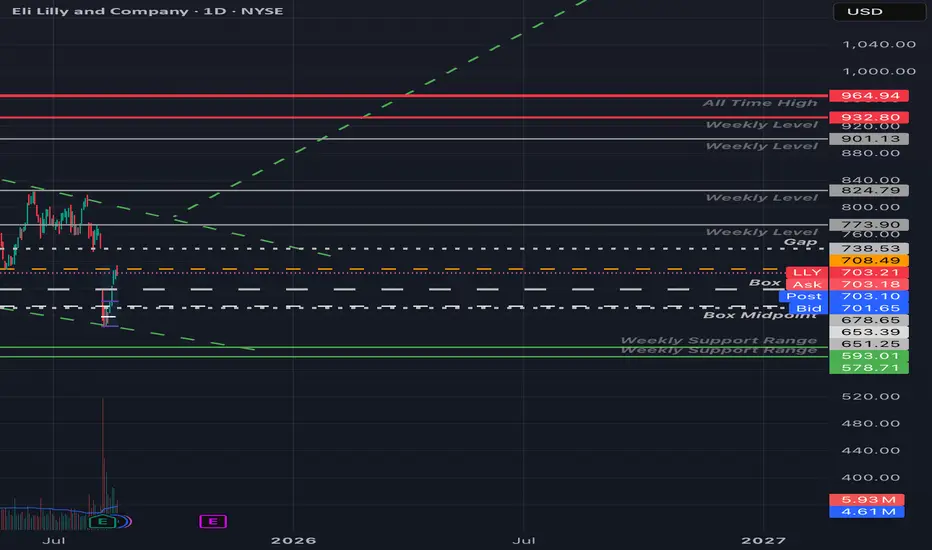
LLY - Clean Levels UpdatedEli Lilly's hit those 708.49 and 711 levels I mentioned in my previous LLY post.
I've added some weekly levels, and a couple relevant spots from my boxed LLY chart.
If LLY loses steam up here we could easily see a retest of that box top area in the $680 - $678 range. Otherwise if we see a market
See all ideas
An aggregate view of professional's ratings.
Neutral
SellBuy
Strong sellStrong buy
Strong sellSellNeutralBuyStrong buy
Neutral
SellBuy
Strong sellStrong buy
Strong sellSellNeutralBuyStrong buy
Neutral
SellBuy
Strong sellStrong buy
Strong sellSellNeutralBuyStrong buy
Displays a symbol's price movements over previous years to identify recurring trends.
XS238628644
Eli Lilly and Company 1.625% 14-SEP-2043Yield to maturity
5.90%
Maturity date
Sep 14, 2043
LLY4099975
Eli Lilly and Company 4.65% 15-JUN-2044Yield to maturity
5.65%
Maturity date
Jun 15, 2044
LLY6153503
Eli Lilly and Company 5.65% 15-OCT-2065Yield to maturity
5.47%
Maturity date
Oct 15, 2065
LLY5750032
Eli Lilly and Company 5.1% 09-FEB-2064Yield to maturity
5.47%
Maturity date
Feb 9, 2064
LLY5871804
Eli Lilly and Company 5.2% 14-AUG-2064Yield to maturity
5.47%
Maturity date
Aug 14, 2064
LLY5547405
Eli Lilly and Company 4.95% 27-FEB-2063Yield to maturity
5.47%
Maturity date
Feb 27, 2063
LLY6003397
Eli Lilly and Company 5.6% 12-FEB-2065Yield to maturity
5.45%
Maturity date
Feb 12, 2065
US532457BU1
Eli Lilly and Company 4.15% 15-MAR-2059Yield to maturity
5.44%
Maturity date
Mar 15, 2059
US532457BY3
Eli Lilly and Company 2.25% 15-MAY-2050Yield to maturity
5.42%
Maturity date
May 15, 2050
LLY5750031
Eli Lilly and Company 5.0% 09-FEB-2054Yield to maturity
5.40%
Maturity date
Feb 9, 2054
LLY6153502
Eli Lilly and Company 5.55% 15-OCT-2055Yield to maturity
5.39%
Maturity date
Oct 15, 2055
See all LLY bonds
Curated watchlists where LLY is featured.


Frequently Asked Questions
Depending on the exchange, the stock ticker may vary. For instance, on BOATS exchange Eli Lilly and Company stocks are traded under the ticker LLY.
We've gathered analysts' opinions on Eli Lilly and Company future price: according to them, LLY price has a max estimate of 1,190.00 USD and a min estimate of 700.00 USD. Watch LLY chart and read a more detailed Eli Lilly and Company stock forecast: see what analysts think of Eli Lilly and Company and suggest that you do with its stocks.
Yes, you can track Eli Lilly and Company financials in yearly and quarterly reports right on TradingView.
Eli Lilly and Company is going to release the next earnings report on Oct 30, 2025. Keep track of upcoming events with our Earnings Calendar.
LLY earnings for the last quarter are 6.31 USD per share, whereas the estimation was 5.60 USD resulting in a 12.70% surprise. The estimated earnings for the next quarter are 6.36 USD per share. See more details about Eli Lilly and Company earnings.
Eli Lilly and Company revenue for the last quarter amounts to 15.56 B USD, despite the estimated figure of 14.70 B USD. In the next quarter, revenue is expected to reach 16.04 B USD.
LLY net income for the last quarter is 5.66 B USD, while the quarter before that showed 2.76 B USD of net income which accounts for 105.14% change. Track more Eli Lilly and Company financial stats to get the full picture.
Yes, LLY dividends are paid quarterly. The last dividend per share was 1.50 USD. As of today, Dividend Yield (TTM)% is 0.80%. Tracking Eli Lilly and Company dividends might help you take more informed decisions.
Eli Lilly and Company dividend yield was 0.67% in 2024, and payout ratio reached 44.39%. The year before the numbers were 0.78% and 77.91% correspondingly. See high-dividend stocks and find more opportunities for your portfolio.
As of Sep 27, 2025, the company has 47 K employees. See our rating of the largest employees — is Eli Lilly and Company on this list?
EBITDA measures a company's operating performance, its growth signifies an improvement in the efficiency of a company. Eli Lilly and Company EBITDA is 24.33 B USD, and current EBITDA margin is 41.75%. See more stats in Eli Lilly and Company financial statements.
Like other stocks, LLY shares are traded on stock exchanges, e.g. Nasdaq, Nyse, Euronext, and the easiest way to buy them is through an online stock broker. To do this, you need to open an account and follow a broker's procedures, then start trading. You can trade Eli Lilly and Company stock right from TradingView charts — choose your broker and connect to your account.