BRLUSD trade ideas

USDBRL Short in 3 months to 2022As I can see from the history chart 200 til now USD/BRL will soon around month 8 go down for about 4 years .

The Central Bank will intervene in the USD/BRL.The Central Bank will offer more foreign exchange swap contracts, equivalent to the sale of dollars in the futures contracts.


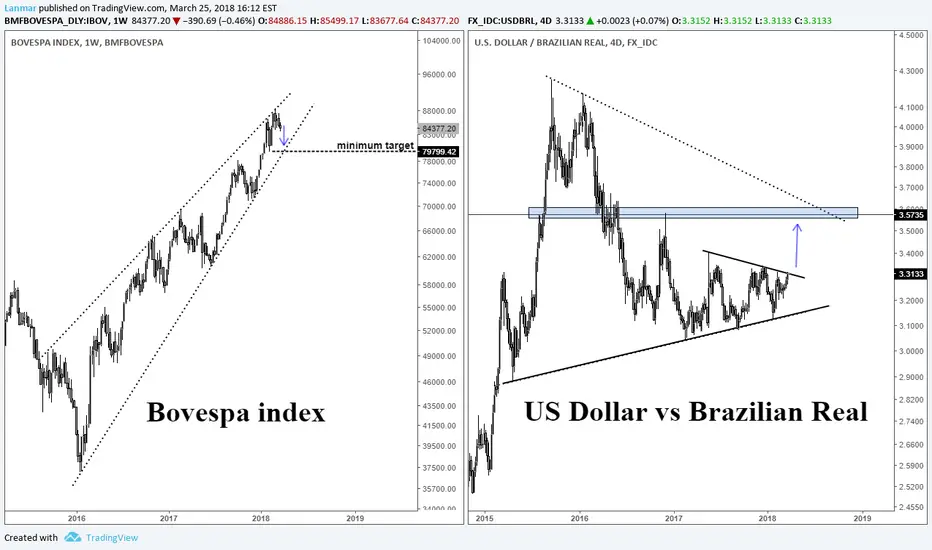
Correction to be continued in the Bovespa (Brazil) indexThe Brazil index, Bovespa, often trades in tandem with the Brazilian Real. The index is showing signs of weakness. A good hedge is shorting the Brazilian Real. This is because the Brazilian economy is exchange rate sensitive. See image below to see its consistency.
If the breakdown in the Bovespa breaks the wedge to the downside beyond the minimum target, I believe it is limited to 74,000. Right into the red box. At that point I will be a major buyer
BRAZIL WITHOUT LULAA NEW AGE WILL COME TO THE SOUTH AMERICA GIANT???
USD/BRL LOW LOW LOW- BUY REAL TOMORROW MORNING


USD/BRL: Buyers ReturnThe negative outlook of early January has faded. The then expected breakout did not materialized. Moreover, buyers have returned and are even trying to trigger a new recovery phase of some sorts. For this they must convincingly clear the barrier around 3.3475 thus paving the way towards 3.4750 and perhaps a bit higher.
Although not spectacular, it is one of various signs that the USD is regaining strength, at least on a 1-3 month horizon. Keep stops nearby at 3.1520.
Primary trend: neutral
Outlook: recovery likely, moderately positive > 3.3475
Strategy: trading-buy above 3.3475
Support: 3.1520 / 3.0810
Resistance: 3.3475 / 3.4750+
Outlook cancelled/neutralized below 3.1520
FX_IDC:USDBRL

USDBRL shown exhaustion candle, maybe short?A Doji appeared at 4 hour chart, buyers exaustion, time to sellers take place maybe, let's see what happens.


USD/BRL bulls satisfied @38.2% Fibos, bears hover with whipsawsOn daily charts, we see stiff resistance at around 3.3346-3.3420 levels where the pair has shown a convincing supply zone in the recent history.
That is where a resembling evening star pattern has occurred that is pulling back from highs of 3.34 levels.
Hanging man patterns at 3.3149 and 3.3121 levels are occurred to plummet the prices below 7DMAs. Thereafter, you could see a steep slump upto the current levels of 3.2369.
However on a broader perspective, in the recent times, it has managed to test the strong supports at 3.2019 (i.e. 38.2% Fibonacci levels on monthly plotting) to bounce back again but upswings are restrained at the same resistance levels.
Most noticeably, the current price behavior in the major trend goes in whipsaws pattern on 21&7-EMAs & 38.2% Fibonacci retracement levels, the current prices are well below EMAs in this time frame.
Both leading oscillators (RSI and stochastic curves) have shown indecisiveness on this timeframe but indicate strength and intensified momentum in ongoing selling sentiments on daily terms, historically it has shown the faded strength at the same levels.
While MACD also signals downswings to prolong further.
Overall, the major trend has turned into corrective modes for more than two years, ever since shooting star has occurred at peaks of uptrend at 4.0093 levels it has tumbled retrace more than 38.2% Fibonacci levels.
Trade tip:
Since, both leading, as well as lagging indicators, are in bears’ favor, deep slumps are most likely. Well, on trading perspectives, it is worth to snap rallies and deploy tunnel spreads using upper strikes at 3.2434 and lower strikes 3.2196 levels where it is likely to test next strong supports.


BRL: CAPITAL IS FLOWING TO THE BRAZILIAN ECONOMY IN LONG-TERMThe long term exchange rate target zones have confirmed the flowing of capital into the Brazilian economy to strengthen the Brazilian real in the market. The medium term exchange rate target zones also have aligned, realigned and continuously realigned to strengthen the BRL in the market. The long term strengthening of the Brazilian economy is expected to drive the long term economic growth for the Latin America. Under OECD memorandum of understanding, China is leading the economic support for the Latin America in long term.
The medium and long term GDP and inflation bands also have confirmed the acceleration of the Brazilian economy. No doubt, the economic performance will be beyond the economists' expectation.

BRLUSD: Technical bottom spottedI think this can be the bottom of the recent pullback in the Brazilian Real. I'm long $BRL as an oil proxy here, shorting $USDBRL with a tight stop at 3.3415.
The political crisis might be averted, and the currency can soar, specially with the extreme negative sentiment currently affecting it.
Best of luck to our brazilian friends, and to anyone taking the trade.
Ivan Labrie.

BRL bottomed?BRL bottomed? I think there is a big chance that brl bottomed, we shall buy it. as long as we are above the highest volume.

Who will win between USD/BRL’s stiff tug of war? Who will win between USD/BRL’s stiff tug of war? Keep doors open pour in yields via ATM straddles regardless of swings:
On daily charts, we see stiff resistance at 3.1950 levels where the pair has shown a convincing supply zone in the recent history.
Shooting star has appeared at 3.1761 levels pulling back from highs of 3.2140 after bears surpassing this stiff resistance to plummets prices below 7DMAs. However, this week it has managed to test support at 21EMAs to bounce back again but upswings are restrained at the same resistance levels.
Both leading oscillators (RSI and stochastic curves) have indecisiveness but indicate losing strength in previous rallies, historically it has shown the faded strength at the same levels.
Whereas MACD signals upswings to prolong further if the ongoing rallies manage to break out above mentioned resistance level.
On a broader perspective, we see the major trend has turned into corrective modes for more than one and a half years.
Ever since shooting star has occurred at peaks of uptrend at 4.0093 levels it has tumbled retrace more than 23.6% Fibonacci levels.
Thereafter, when prices slid below EMAs it has managed to retrace below 38.2% Fibonacci levels again. Most importantly, whenever it showed the stern bearish effects to cross the significant Fibonacci levels the bearish candles with big real bodies have popped up that is in conformity to the weakness in the trend.
RSI on this timeframe has evidenced downward convergence that signals no strength in rallies.
While MACD indicates downtrend to prolong further but remains in bullish trajectory.
Overall, current prices are lingering at 38.2% Fibonacci levels which are just 50 pips away from above mentioned stiff resistance levels. Hence, we conclude by saying if bulls manage to break out this pivot levels then the ongoing rallies may like to extend further, otherwise failure swings can resume southward travel upto 2.8891 levels (i.e. next strong supports at 50% Fibonacci level).
Trade tips:
Well, on hedging perspectives, keeping an eye on decisive breach resistance at 3.1950-20 levels and the major trend that is weaker, contemplating above technical reasoning we advocate below option strategy:
Options straddle is the best suitable in such uncertain circumstances with 50% delta.
Long options straddle that likely to fetch unlimited returns during above mentioned higher implied volatility scenarios short term.
Thus, initiate long in 2M at the money -0.49 delta puts, simultaneously go long in 2M at the money +0.51 delta call and limited risk to the extent of initial premiums paid options.

