ABB India Ltd NSE:ABB
Already hyped on all timeframes.
Early investors should book profits.
Very short term swing trading setup.
*Not a financial advice.
My charts speaks louder than words.
I'm a chartist and I paint charts.
ABB trade ideas

ABB on watchlist| Possible Ascending triangle breakoutABB is bullish on multiple timeframes and is consolidating in an ascending triangle near ATH. Sustained close above 3,450 with decent volumes make it ideal for a breakout. If not the stock can retest the lower trendline of the triangle.
Note: This is not a buy/sell recommendation. Just learning and sharing my views for educational purposes and open to feedback from the community. Thanks!

ABB: SWING TRADEABB Looks good to buy above 3440
ABB Tried a downmove, but buyers are strong and pulled it upwards
We can see a sharp upmove in ABB in coming days
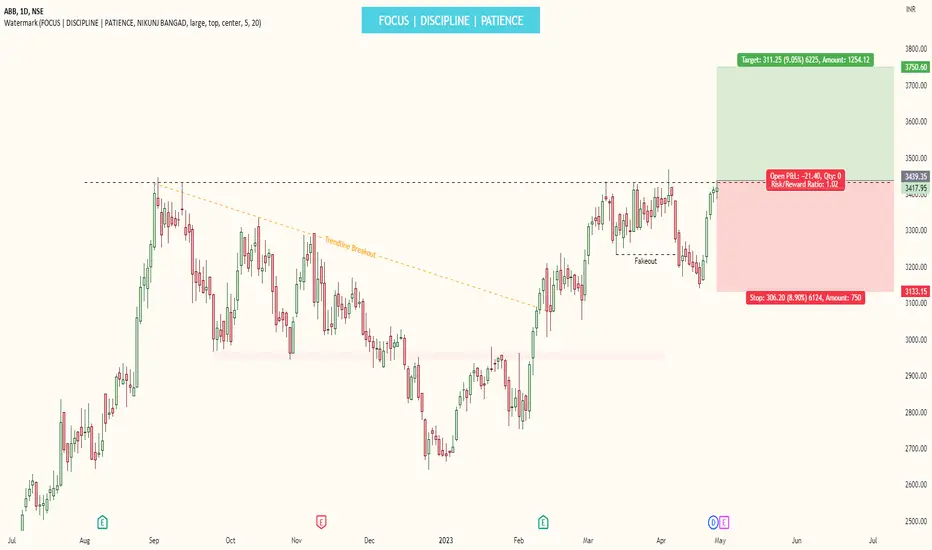
ABB - clear strength Showing strength - forming good range near resistance of ATH. 'will break it soon

ABB SHORT Trend channel pattern was easy to make, stock has taken a turn for the worse and it will touch bottom.

ABBABB - The CRAB harmonic
A daily close above Point has activated the 2 mentioned targets on the charts.
One must maintain a SL of 2900

Flag & Pole Breakout in ABB India LtdFlag & Pole Breakout in ABB India Ltd
Entry at 3050
SL at 2750
Target 3300 / 3450 / 4000
View: Positional (6 months to 1 Year)

#ABB chart #trading #banknifty #trader #investing ABB taking support resistance drom trend line and also take a support from buyin zone have a look on this stock for the swing orr intraday purpose

ABB..,,BuyGood clean breakout into a new zone..So stoploss entry and tgt is mentioned clearly on the chart..please do read ,what is written on the chart


BROKE UPSIDE WE LL LOOK FOR LONG, OR BREAKS DOWN WE CAN GO SHORTDisclaimer
The information and publications are not meant to be, and do not constitute, financial, investment, trading, or other types of advice or recommendations supplied or endorsed by TradingView.

ABBABB day chart making ascending triangle pattern it can again touch its all time high support zone is 2980

ABB_DailyLooks good.........................
ABB is a Swedish-Swiss multinational corporation headquartered in Zürich, Switzerland. The company was formed in 1988 when Sweden's Allmänna Svenska Elektriska Aktiebolaget and Switzerland's Brown, Boveri & Cie merged to create ASEA Brown Boveri, later simplified to the initials ABB .
educational purpose only.

ABB_DailyLooks good.........................
ABB is a Swedish-Swiss multinational corporation headquartered in Zürich, Switzerland. The company was formed in 1988 when Sweden's Allmänna Svenska Elektriska Aktiebolaget and Switzerland's Brown, Boveri & Cie merged to create ASEA Brown Boveri, later simplified to the initials ABB.
educational purpose only.

Abb nse stock bullish breakout could be happen in some weekIts abb nse chat happening down trend channel at top side to controll buyers. It will give very good breakout and returns its study purpose invest as peramiding method risk is yours and profit is double.

ABB is forming triangle patternNSE:ABB large cap stock is facing rejection at its resistance 5 times in 2 months.
A strong breakout can result in good up move along with bull market.
In case of reversal, clear triangle can be formed.
Key note : Always follow proper risk management to avoid losing capital from false breakouts as this is common.
Caution : This is a knowledge sharing analysis, not a call.
Profits are not made from following ideas, but by following Risk Management .


ABB - ABC harmonicABB - ABC harmonic pattern
One of the prime wights in capital goods sector.
Upon breaking out from Point B, one can aim for Point D as target

ABBNOTE: these are virtual trade, not taking live trade. (high risk, using 5.34 x leverage in future trade) if it went wrong and spot went up 18% when capital would wiped out. stay safe. i am testing whether my analysis are right or wrong. if u have any suggestion comment below
reasons:
1) stock breaks it trend
2) break inside day candle (check on learnapp you tube channel)
3) loss in momentum rsi falls below 50
today overall market fall maybe that can be the reason for stock fall. "low volume". these are some concerns

Stock: ABB LongStock: ABB
Entry: 3320 (Enter Step Wise and remaining amount at 3450 during the BO
Analysis"
1. Forming a Stage Structure
2. Wide-range candles with volumes are spotted
3. need one more candle at the region I have highlighted
