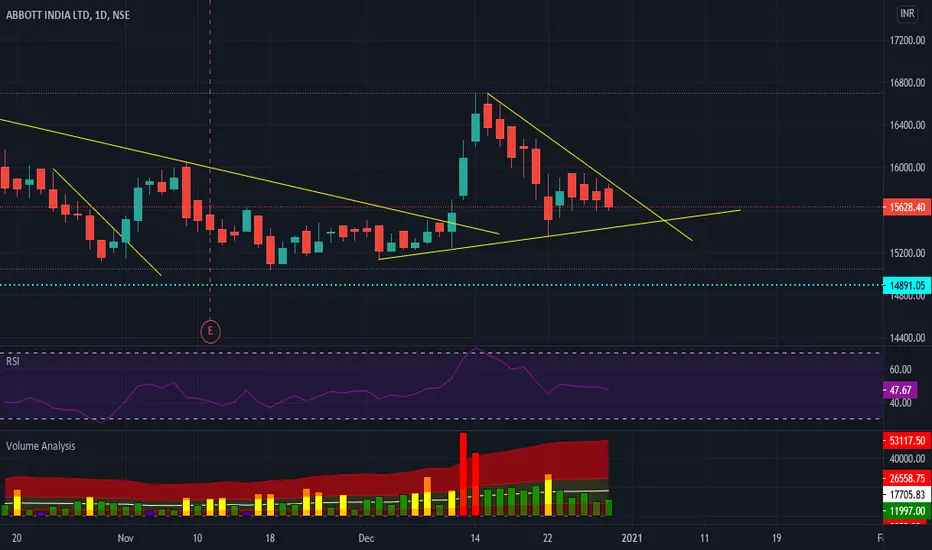
Abbott India major support breakdown today... lets see it is simply a shake out or it will go down more... next support and value area marked...
lets see price reaction of stock in those mention areas.. and act accordingly... long only if one see reversal confirmation candle patterns
ABBOTINDIA trade ideas

Abbott India- FlagsPeople have written obituaries about this stock, as it is not moving since March 2020.
Stock has also closed below its 200 ema on a daily chart (which is generally considered bearish sign)
I may be wrong here, but what i see is stock is nicely moving in flag formation on a weekly chart. It is consolidating for now.
I will enter once that level breaks.

At Support AreaAbbott at weekly support Zone... one can go long if get reversal pattern in shorter time frame ... sl 14730

PRICE ACTION STRATEGYSee all my Publications if it seems to give you both knowledge and profit then only like subscribe and share to your near and dear.
thanks for my masters trading panthulu, day trader telugu, and nayan pokarkar.
These are all for educational purpose please consult your financial advisor before investing your hard earned money.

Abbot India seems good to investIt seems very good to invest would give 25% in return in 2 to 3 months or maybe soon than this ABBOT INDIA


ABBOTINDIA - Breakout after consolidation - SwingThis analysis is done purely on basis of price action and chart patterns.
The analysis is done on weekly TF hence it can take couple of weeks to reach the target. But as the stock is in bullish trend on longer TF, it may reach target within few days as well.
Trade Logic, SL and Target is shown in image itself.
Daily TF chart is attached below for reference.
This analysis is for study purpose. Traders must do their own study before entering into any trade. Traders should trade with their own risk capacity and money management.
Feel Free to comment for any query or suggestion regarding this stock or Price Action Analysis


ABBOTT INDIA LTD Weekly Bullish GARTLEY TYPE 2
Earlier this same GARTLEY given good reaction on Type1 entry at 0.886XA & hit Target 1
now price again reached 0.886XA making its a TYPE2 Entry which is REVERSAL
Now with confirmation from a BULLISH CANDLE with RSI above 30
POTENTIAL BUY


AbbotINDIA at good supportWe can look at the stock from a long term view and accumulate at support S1. In case price falls further the stock can be accumulated further at S2 and S3 levels.


A tale of Gap'sNSE:ABBOTINDIA
Gap is called as Window in Japanese terminology , which can show the continuation of a price trend based on the price behaviour once it fills the gap!
Window is a continuation chart pattern!as most other patterns shown by Japanese candlestick are Reversal patterns!
Excellent price support and behaviour shown by ABBOTT INDIA, as the pharma industry has already rallied,shown a lot of participation!
looking for good oppurtunities in the stock!


ABBOTT INDIA - taking a pause nowNSE:ABBOTINDIA is facing a huge over head supply now.
Longs are doing profit booking.
