AMBUJACEMENT 1HKey support & resistance levels are marked on the charts through fibonacci go through it.breaked the upper trend line.looking like a triple top in 30min.confirm by volume
AMBUJACEM trade ideas

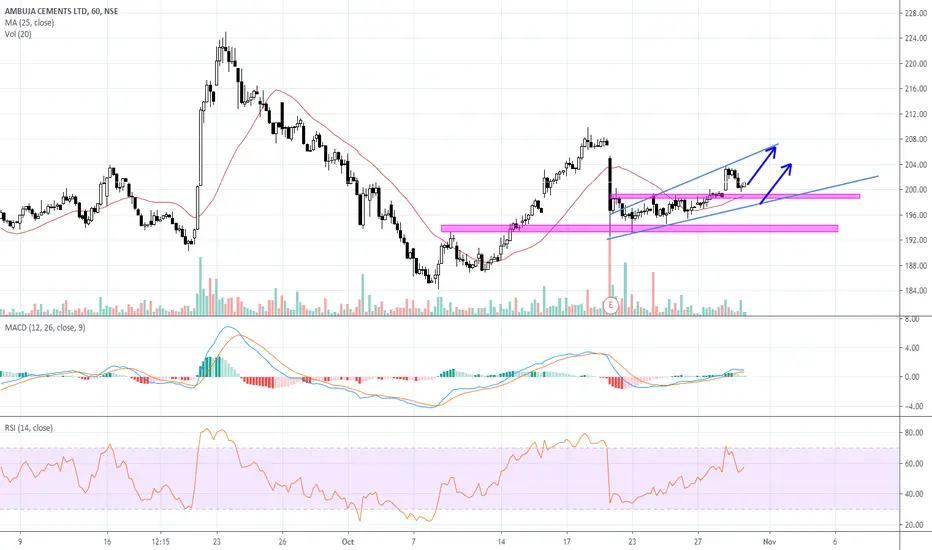
AMBUJA CEMENTS | Price Action AnalysisThe price is currently in a side trend and a long term uptrend. Looking more likely to continue to move upwards upon breaking the key trend. We already see the volume above its 20-period average and likely to continue with the momentum.
Next key level at 174.05
Thank you for reading, hope you have a green day

AMBUJACEM - OPIND0001Opportunity
-Price is not able to close below 1340 in 4H (C1), same outlook for 1D (C2).
Caution
-Breakout could be in any direction as industry is in different direction of overall market.

Flag pattern : Ambuja Cements LTDI joined some Telegram group Which give Buy & Sell Calls there I saw Sell Call for NSE:AMBUJACEM .
So I looked at chart to know to understand.
First I saw Heiken-ashi Which is showing Two Green Candle without tails so it should indicate the Bullish trend ahead.
But then Noticed a Flag Pattern also.
I am Not sure now but i think stock should go down around 60 points.
I am not good at finding Targets so please suggest at what price should we short & what should be stop loss.
Correct me if made any mistake as i am here to learn & grow.
Give Suggestion i love to Read comments.

AMBUJACEM intraday strategy - 3rd April 2020Open position Strategy
Gap down Long @ 146/148 , T1-152 , T2- 154
Gap up Short @ 164 more @ 161.3, T1-160, T2-157
Between Pivot & R1 Long @ 156, T1-159 T2-161.3
Between Pivot & R2 Short below 154.5, T1-152 T2-Nil (High risk of reversal)

Position: Long Ambuja Cements at ₹ 212.9Goodluck Capital Recommendation
⭐️ Ultra Equity Advice
Buy Range - 211-213,
Target - 220-230,
Stoploss - 205,
Maintain recommended stoploss by daily closing basis.
Once 1st Target hit, reset stoploss at 216.


AMBUJACEM LOOKING BEARISHAmbujacem trading in a triangle pattern and made bearish engulfing candle
BELOW 214 MAY TARGET 197--190--185

Ambuja Cement Chart Levels223-223 is seen to be a stiff resistance. Price rejected multiple times from the zones.
If breaks with conviction, then only on the buy side for further target of 245-250 zones.
Both time rejection candles seen near price zones.


AMBUJA CEMENTIf crosses 220 then upside possible with targets marked in green for upside.
RED line indicates strong support.
If falls to that or below then lower green lined targets are possible.


241PA.. BV SetupMany times Market does not provides good and ideal entry points. Hence needs PITS for your entries and exists (Profit taking point 1 (PT1 or PT2) or Stop loss points (SL)).
Disclaimer: Set-up shown here is only for Educational purpose only; This is not a sell or buy recommendation. We are not responsible for any loss or gain; Consult your financial advisor before your execution of any recommended trade.
Set-up presented here is for observational purpose only and most of the set-up designed by WavoZen is based on passive analysis (PA) or static analysis for intraday purpose only to get the basic structure for intra-day short term or ultra-short term purpose only. Most of the set-up is valid for a day or otherwise mentioned. Hence requires your fine tuned personalized intraday techniques and strategies (PITS) based on real-time Active Analysis (AA) to get benefit from these structures or to have minimum loss, if wrong through your PIT Strategies (your trade plan). Overnight events, news, major economic data release etc may impact the deviation from the assumed scenarios.


AMBUJA CEMENTS LTD inside bar trade Long if it breaks the high of the previous day with a stop loss at the previous day's low.
Short if it breaks the low of the previous day with a stop loss at the previous day's high.
In case of gap up above the previous day's high or gap down below the previous day's low, please avoid buying it or selling it respectively. Follow the ending of the candle formed in first 5 minutes and follow ORB strategy.

AMBUJA CEMENT FORMING PENNANT PATTERNHello all,
Ambuja is currently under in pennant pattern which is a bullish breakout pattern. Confirmation level is above than 225.
