Balaji a-mine of gold?If chart follows drawn structure and we get a BO, it will end the fall of this counter, this stock may go crazy above 2550.
BALAMINES trade ideas

BALAMINES - Weekly AnalysisIn the Weekly Chart of BALAMINES ,
we can see that, After the Failure of W Pattern,
it is now in formation of Cup & Handle Chart Pattern.

Balaji amines limited: An opportunity for value investors.Balaji amines is going through a deep cyclical price correction , due to fallen demand of amines and amines derivatives in Pharmaceutical industry, Petrochemical, and specialty chemical sectors, surge in raw material cost and lower demand overall affecting earnings. Thus amine stocks have seen 50 % to 60% price correction. But over the past 3 decades amines industries has been on an average rising 10% to 15 % per annum making over 500x times over multi decade returns for its long-term investors. Amines industry also has high barrier to entry in its business, they cannot be imported nor exported over long distance due to associated combustible hazards, so they can act as regional monopolies in longer run.
Deep cyclical correction and stock going through maximum pain is perfect opportunity where value investors can time their bets and wait patiently for profitable cycle to emerge and reward them. Risk is already factored and negated, any further down side becomes an opportunity to pyramid upon existing thier investment.
Technical analysis for Balaji amines at 4 hours TF
Point of control for price 2131 above it rises with strong buyers volumes and falls below it with strong sellers volumes.
Breakdown level 1947
Value investors opportunity levels 1809/1708/1612
Heavy overhead price supply zone 2798/2927/3111 price will resist and revert to price of control 2131
Major breakout only above pivot range 3278 to 3498 for momentum investors with targets T1, T2 and T3 as per fibbonaci levels.

Balaji amines limited: Deep Analysis for value investors Balaji amines is going through a deep cyclical price correction , due to fallen demand of amines and amines derivatives in Pharmaceutical industry, Petrochemical, and specialty chemical sectors, surge in raw material cost and lower demand overall affecting earnings. Thus amine stocks have seen 50 % to 60% price correction. But over the past 3 decades amines industries has been on an average rising 10% to 15 % per annum making over 500x times over multi decade returns for its long-term investors. Amines industry also has high barrier to entry in its business, they cannot be imported nor exported over long distance due to associated combustible hazards, so they can act as regional monopolies in longer run.
Deep cyclical correction and stock going through maximum pain is perfect opportunity where value investors can time their bets and wait patiently for profitable cycle to emerge and reward them. Risk is already factored and negated, any further down side becomes an opportunity to pyramid upon existing thier investment.

Balaji amines short term Swing stocks Just a view not a call
I will buy above the blue line if the price trade above the line EOD

29 % fundamentally expected on long side of a Amine Company spotBAL commenced manufacture of Methyl Amines in the year 1989 and subsequently added facilities for manufacture of Ethyl Amines and other derivatives of Methyl Amines and Ethyl Amines. BAL has been consistently adding capacities and fine tuning process to provide quality products at lowest cost to the customers.
for more intrady research wsup on 8459 22 0202

BALAMINES - Weekly AnalysisIn the Weekly Chart of BALAMINES ,
we can see that, after a huge correction of more than 60% .
It has given a very strong recovery in W pattern.

BalaMinesBalamines is at the Perfect range to Fly again at the Higher Range. SL and Target Mentioned Chart

BALAJI AMINESThe company has a diversified product portfolio with a basket of over 25 different products. These products are categorised under 3 main categories i.e. Amines, Amine derivatives and Specialty & Other chemicals.
Return on Equity
10 Years: 26%
5 Years: 27%
3 Years: 29%
Last Year: 34%
Compounded Profit Growth
10 Years: 27%
5 Years: 36%
3 Years: 47%
TTM: 36%
Price to book value
7.94
Company is almost debt free,is expected to give good quarter, delivered good profit growth of 35.5% CAGR over last 5 years
TARGET - 4000 - 5000 -5500
SL - 2550

Balaji Amine...Double top formation and neckline breakdownBalaji Amine...Double top formation and neckline breakdown....Further fall is a possibility....At this stage accumulation can be started for short to medium term perspective...


I invested on Balamines. LongI invested some little amount on Balamines last week. Sorry for delay in posting.
Good for long term investment. More details are mentioned in chart.


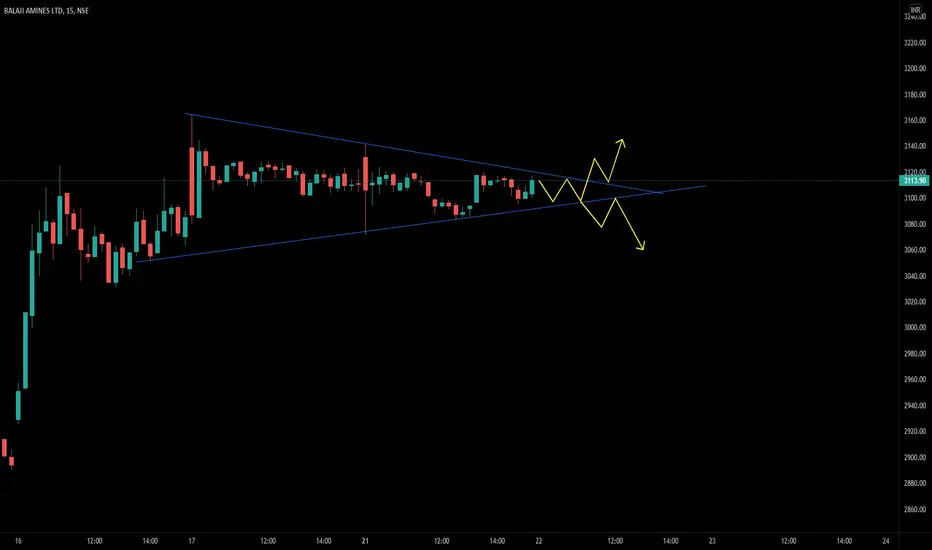
BALAMINES : Triangle pattern BALAMINES trading in Triangle pattern .
wait for any side breakout & confirmation before entering
Like, Share, Comment for regular updates.
Disclaimer
I am not sebi registered analyst
My studies are Educational purpose only
Please consult with your Financial advisor before trading or investing

Balaji Amines swing trading analysis. Balaji Amines swing trading analysis.
Today, the stock has made an attempt
to move above this selling zone.
But see how the selling pressure
came into existence.
See the upper wick is so high than
it's the body. It is clearly indicating
the supply is still there and should be absorbed.
This is a strong supply zone and
as stock entered into this zone ppl are selling.
A huge volume is needed
to breach this selling zone.

Bullish pattern in BALAMINESPeanut formation with 50 & 20 EMA crossover..
RSI also taking great support on 60 level.Can be a great buy for Swing trade after breakout of the comsolidation.

BALAMINE LONG TERM1. Its in Accumulation phase .
2. Over the last 5 years, revenue has grown at a yearly rate of 15.32%, vs industry avg of 3.49%
3.Over the last 5 years, net income has grown at a yearly rate of 32.82%, vs industry avg of 10.86%
4, Strong Financials :-
3 year CAGR growth
Revenue 14.9%
NetProfit 28.1%
OperatingProfit 25.3%
5.34.72% away from 52 week high , Nice correction has given opportunity to accumulate at these levels
6.FII/FPI have increased holdings from 2.35% to 4.0% in Sep 2021 qtr.
7.Institutional Investors have increased holdings from 2.65% to 4.49% in Sep 2021 qtr.
8.1 Month: Delivery volume fell by -42.05%
9.1 Day: Delivery volume increased by 386.08% over 5 day average

risky trade buy or sellcmp; 3409
buy above 3500
sell 3000
H&S pattern on 1D tf
Disclaimer:
All information shared is just for educational purposes.
By no means shall we be accountable for any debits/losses amounting out of it.
We are not SEBI registered Analysts, so please consult your Investment Advisor and take rational decisions.

Picture perfect patternTriple Bottom Pattern in Balaji Amines. Confirmation and trend reversal above 3350.

BALAJI AMINES LTD (LONG)Good volume coming in this Stock
It took support at 200 EMA
BUY near 3000
SL 2700
Tgt's 3500 - 4018 - 4256 - 4450 - 4990
Please Correlate by yourself also on charts. This is for Educational and Paper Trading Purpose Only. Must Consult your financial advisor before Investing.

BALAMINES LONG TRADE1. Bounce back from support zone.
2. Bounce back from 200 SMA
3. Short term trend line breakout
CMP : 3279
T1: 3889
T2: 4375
SL: 2885

BALAJI AMINES LTDMust Correlateyourself on charts before taking an entry. This is for Educational purposes only. Please consult your Financial advisor before investing.
