GRAPHITE trade ideas


GRAPHTE - W Breakout / Trendline BreakoutAs on 25-05-2021
W Breakout / Trendline Breakout
Volume > Avereage
Stoch turned from oversold
Stoch FBS top
RSI > 65
Full Body , < 20% Selling wick
Final Target 915 ( Height of W @ 172 points )

Graphite making a big rounding bottom Graphite will be completing a rounding bottom pattern. Pattern will be completed at 1024 which is almost 30% upside

Graphite in next week ( 10th May to 14th May 2022)In the coming week graphite may show some consolidation. But in the end it will close positive. Monday will show some buying so the price will move up further. At the end of this week Graphite might go near Rs 804. Let's wait and watch. IN THE LONG RUN IT WILL ACCOMPLISH MANY MILESTONE. I AM BULLISH.

Long Bull RunSteel and supporting industries are in a long bull run. Untill graphite india is above the red trendline, the script is in a bull run. If its breaks green trend line, go crazy.

Graphite India Graphite india Long term chart showing cup pattern in making it can go to 2,000 levels in long term(3 to 5 Years)
Advantages
Commodity cycle
Steel Price Soaring up

flag breakoutprice has formed flag and broke with volume, seen weak sellers in few last sessions. breaking with wide spread, price is above 200 MA, with last swing low as sl (positional)

Graphite India weekly Weekly chart of Graphite India today resistance faced near 594 if this resistance cleared or Breakout happens then it could move towards 800

GRAPHITE INDIA Graphite India today touches its resistance at 594 levels it may consolidate here if Breakout comes then eyes will be for next traget 780

Long position for GRAPHITE INDIAThe price has broken the barrier and closed above the parallel zone on a 1-D chart.
MACD is about to close the gap and move in the positive zone. RSI is upwards.
So expecting an upwards trend in the coming week if the market stays positive.

GRAPHITE LONG INTRADAY 12 MAR,2021Dear trader,
If u look at the chart of GRAPHITE (analysis based intraday only) the GRAPHITE support 1 at 512 and Target at 525 and Stop loss at 500.
The chart clearly indicates Bullish Trend you can also see the candle stick patters for more indepth analysis.
In Intraday most important thing is to enter and exit points.
Our signals are based on analytics, algorithms, mathematical derivatives.
Always be a responsible trader, kindly trade only when you have maximum opportunity in the market with minimum risk and with keynotes like data, analysis and proper strategies.
Kindly message us for strategies and analysis.


Graphite Breakout Today Graphite gave breakout on daily time frame
Graphite is rising with strong demand candles there is hardly any supply candle visible on chart, volume is also expanding with price this is sign of strong hands buying in momentum
one can long graphite here or wait for pullback till 508-500 sl is at 438


Graphite - Pick Me upGraphite - It is now in that polarity zone. More likely to cross the line on the other side towards 600+. SL is below 420. Let us see.
DISC: Not a SEBI Registered. I post charts for my own study.


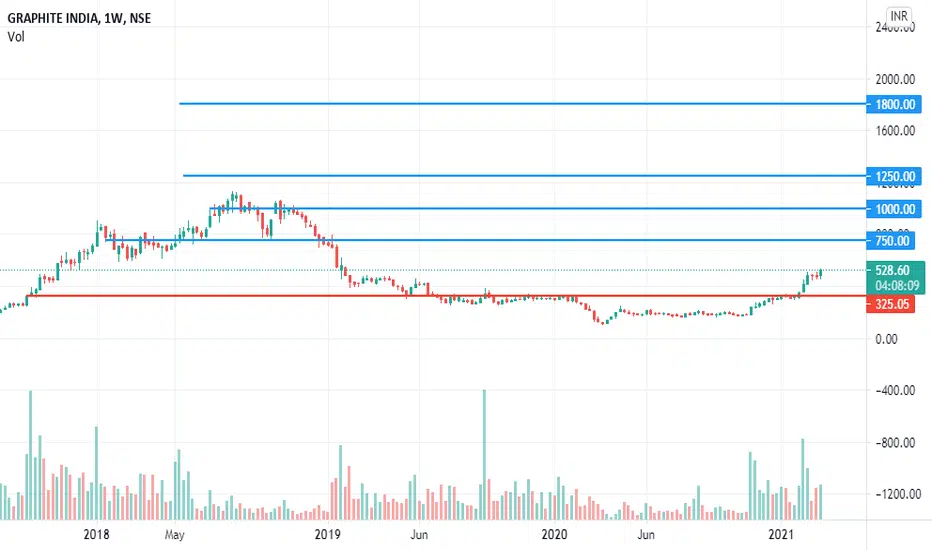
GRAPHITE SWING IDEA!GRAPHITE AFTER A 3 YEAR CRASH, SHOWS SIGNS OF REVERSAL AND RECENTLY CLOSED ABOVE A STRONG MONTHLY SUPPORT.
WE MAY CONSIDER AN ENTRY BETWEEN 270-280 LEVELS FOR A SWING TRADE.
TARGETS ARE IN CHART...
NOTE: NIFTY @ ALL TIME HIGH AND ENTRY AT THIS TIME IS ONLY FOR STRONG HEARTS!

Graphite India - Range Breakout with VolumeGraphite India - Range Breakout with Volume
SL - 215
T1 - 288
T2 - 329
T3 - 392

