NCC trade ideas

NCCChart giving [ i]brake out on daily time frame
So can buy for long term 1st target 100
Can took STOP LOSS closing basis 80


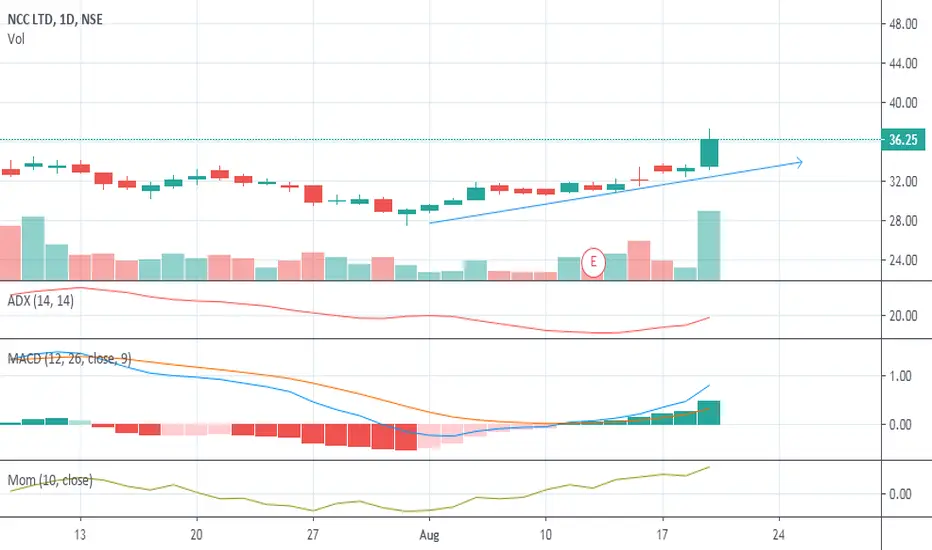
NCCCan Enter with limited qty for tracking.
Later can enter more once it breaks the channel upwards.. or Exit once it breaks the resistance downwards.

TIME TO BUY Now looks like cup and handle pattern formation ,almost cup pattern formed then handle pattern going on , so keep on eye when 89 crossed, then its reached 95 to 100 in short term ,goodluck ..........

NCC - Up move resumes The NCC stock had previously peaked at around 100 levels in early February 2021. Since then, the stock was in a clear sideways/downward trend and had taken support multiple times at the 200 week SMA (currently near 74.5).
This week, NCC broke out of its range and closed at 88 levels. It also closed above the 2 recent resistance trendlines as shown in the chart (blue and red resistance TL). The stock is now in a clear up move and should head higher
Resistance/Target: The Feb 2021 high at 100 is the first clear resistance/target for this long trade. Once crossed, 2018 price levels of 110-130 will come into play. Any weekly close above 130 will lead to a big upside going forward.
Stop Loss: Maintain a WCB stop loss below 83

NCC Positional viewNCC Positional view
Pole and flag pattern form on daily chart frame.
P&F pattern BO possible.
CMP 73.
Buy if hold the level 75/77.
Targets and SL mentioned on chart.


NCC LTD , Go LongIt is expected that NCC LTD can move upwards and make new high, You can go long here :-

NCC - Consolidating for a Break outNCC - Looks like a potential pocket pivot candidate. Keep on watch list. A weekly closing above 101, we see a potential to touch 120. SL 80.
DISC: Not a SEBI Registered. I post charts for my own study.


Inverse Head and Shoulder breakout in NCCNCC Ltd got new orders worth 8900 cr.
It has formed a Inverse Head and Shoulder pattern on the daily chart.
On 1/1/21 it broke the 52 week high with great volumes.

BULLISH FLAG PATTERN price has formed bullish flag, and above 200MA, poor selling in flag and quality buying ,well stock has moved too much with breakout, now either go long once breaks high with volume or enter if gives pullback ,
stock has moved 88% from our previous recommendation (check private published call)


Its gonna shoot up.. Very fast upto 70% profit!!In sweetest spot to buy right now. Trading plan swith RR shown in chart

LONG TERM BUY IN NCC LTDjust stumbled upon this stock, very nice expanding flat in making in weekly chart for major buy.
look for it if you are looking for longer trades.
thanks
tc


ncc 48 targetAS per trend and momentum, result is same as per projection, so it may touch 48 in few trading session