RAYMOND trade ideas

Channel BORaymond has BO'd out of the channel and could reach 479. Fundamentally not a very solid company, I would not trade for longer periods...Do your research. This is an idea, not recommendation to trade. Targets are highlighted by horizontal lines.


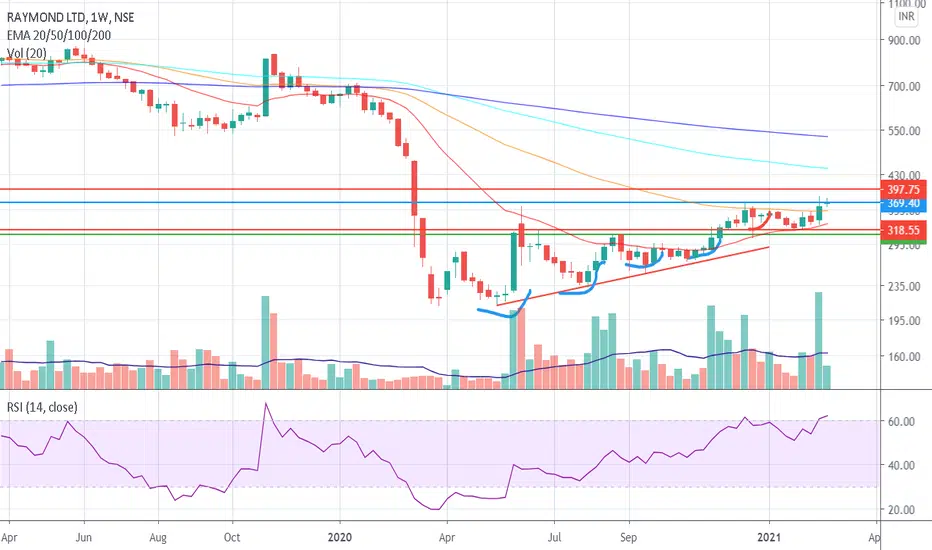
RAYMONDIt has broken its previous high and moving above those levels, if sustains 400-405 levels, it can show 440 and 465 in coming days.
************************************************************************************************************************************************
Hi all,
Its pleasure to have you all here.
I have started putting these charts as a contribution from my side to all people who are new to business, as I had to struggle a lot without any sources at disposal. So please consider this a just small contribution from my side.
Few Honest Disclosures:
1. Any idea shared is my personal view, its not a recommendation, neither any kind of paid propaganda, so please
do your bit of research.
2. Ideas shared does not mean that I trade all or have position in them, this is just a helping hand to all.
3. I expect no comments or like nor any negativity, as I said its just a small helping hand from my side, please plan your risk and trade as per your capacity.
4. To trade in Cash, options or futures is your sole choice and your own risk
5. I am no expert in Tech Indicators, I believe in support resistance and trendline theory, you may use this as a supplement theory for better results.
6. I work for my own living, this is a hobby which I do sincerely to help anyone who might come across my charts.
***********************************************************************************************************************************************


Raymond - The complete man at his own paceRaymond - Making a slow but sure move week by week. First bought at 298, pyramided at 345 and riding since.! Looking forward to a weekly closing above 400 for a dash towards 515!. TSL is 335!
DISC : Not a SEBI Registered. I post charts for my own study.


delivery trade buy raymond above 329 sl 300 tgt 500 plusplease buy raymond looks good on chart buy above 329 tgt 362 and 500 plus sl 300 . only delivery

BIG BREAKOUT IN RAYMONDTEXTILE INDUSTRY RECOVERING AFTER LONG PERIOD OF CONSOLIDATION
BAN ON CHINESE IMPORT ADDING ADVANTAGE TO TEXTILE SECTOR
PLEASE SEE CHART FOR FURTHER DETAILS
TARGET 1: 375
TARGET 2: 400
STOP LOSS : 280
**These are my personal observations. Please trade at your own risk.**


Raymond LongRaymond has broken out of symmetrical triangle pattern and with good volumes. Expecting targets of 361

Raymond Share Price Movement during Festive Season> Price Generally Moves Upside as Demand for Cloths Increases During Festive Season.

Raymond at breakoutRaymond is at breakout point... wait till 296 to cross and 15 mins candle strong close it can also retrace to 257 SL is 252... buy 100 every day or based on your capital depending on SL... if it retrace to 257 strong buy with small stop loss of 5 points... i dont think it will reach there unless US news is bad...

raymond, multibagger
Raymond sould become multibagger from now on , can be double in no time, as its forming symmetrical traingle pattern after traingular target it will be in somewhat open sky till 700+, jusyt hold your patience, as you know patience is the best investment you can make into the market.
time 2-6 months.

RAYMOND 4HRBullish GARTLEY TYPE 2
Earlier this same GARTLEY given good reaction on Type1 entry at 0.886XA & Hit Both Targets ,now price again reached 0.886XA making its a TYPE2 Entry which is REVERSAL
Price need to follow Green Trend line & hit target
If price Breaks Red Trend line is where EXIT before SL hits
POTENTIAL BUY

R-0217 Cash Sell RAYMOND @258.15-259.15 SL 263.8 TGT 248Intraday Cash Sell RAYMOND @258.15-259.15 SL 263.8 TGT 248
MACD cross over + TK line indicates bearish pattern + next support is 243 so GO SHORT


