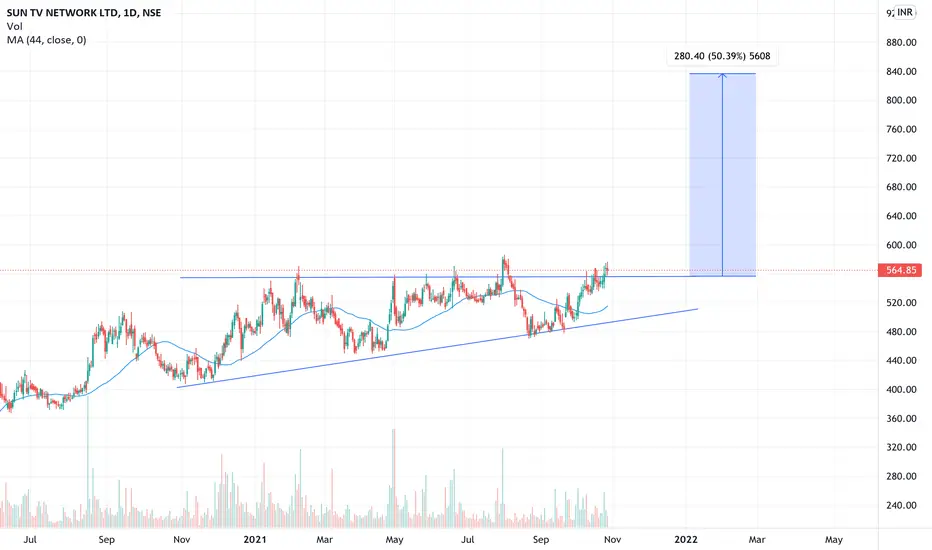
LONG TERM BUY OPPORTUNITY IN SUN TVCan be a good longterm buy in SUNTV
Target Levels are mentioned in the chart.
SL Below 535
SUNTV trade ideas

Great Opportunity in Sun TV - Breakout CandidateThe stock may given a multiple breakout in next coming week after good consolidation. The risk and reward is very favourable with ratio 1:3.
Points considered in analysis: The chart analysed on weekly time frame and for positional trade only.
- Ascending Triangle Pattern
- Volume accumulation in past few week
- 2 year resistance breakout
- Morning Star Candle
- Fib support at .618
Entry, stop loss and target mentioned in chart itself.
Disclaimer : Consult financial advisor before investing or trading.

In Watchlist,Will Wait for ConfirmationSUNTV a Fundamentally good stock has been in consolidation for quite a long time , Will wait for proper confirmation .


suntvIt forming a triangle pattern in one hrs chart, and have a delivery & volume breakout (10days). And a crossover of ema 9, ema50 is forming in day chart.
so there is a positive view, I am going long my upper tgt is 530/533 and buying price is 524-525, sl-519.
this is only for learning purpose, plz do your own analysis before taking the trade.

Sun TV BuyBuy Buy
Disclaimer: Don't just blindly Trade or Invest, learn and then trade. Manage your risks properly.
This analysis is purely for EDUCATIONAL purpose

SUN TV might continue to stay bearishGot rejected from 50 EMA, already below 200 and 21 EMA, has broken the channel also, might see a bearish trend in the stock.

Suntv for few months, for potential rallySUNTV has tested resistance zone multiple time and now it got weaker can expect this time breakout and this will lead to good rally in it,
as it is weekly chart it will take time to move, enter only if you have holding patience
Note: This is only for learning purpose do your own analysis before taking any trade. Thanks

SUNTVIt has activated a Bullish Harmonic Cypher which is suggesting a pullback till 500-520 as long as it does not breach 470

long positional i am a novice trader its just my analysis..
as per charts and patterns .. i can say first target 615 its in channel if it breaks the channel 637 .if it will move further it might touch 700

suntv flag pattern targetsuntv flag pattern target 615. so we can expect if it sustain above breakout level

SUNTVSUNTV just gave a perfect breakout of cup with handle pattern. Best level to buy is at 570. I have my entry from low levels, in the expectation of the breakout. One can accumulate it around 570 levels for medium term.
All levels are mentioned on the chart.

Buy Sun TvAs you can see, Sun TV has given multiple tops breakout yesterday on weekly charts. From last 2 years this stock was consolidating below 550 and multiple times it has tried to breach this level. However, it was unsuccessful and stock fell down. Yesterday, on the contrary, stock has given a breakout with good volumes. Targets as per Fibonacci are 724, 1012, 1300 and 1478. Target as per short term weekly chart is 628 W. SL 528 W. This stock is good buy for Long term, taking in to consideration of its political influence. Therefore, keep a deep SL for higher Fibonacci targets.
View - Medium to Long term
Time - 1 year plus.

SUNTVResistance breakout... This chart is meant for learning purposes only. Invest your capital at your own risk

Sun Tv Network Bullish Reverse Head and Shoulder PatternSun Tv Network Bullish Reverse Head and Shoulder Pattern

BUY SUN TV NETWORKAscending triangle pattern in weekly chart
Targets mentioned in the chart
One can initiate buy around 540
For long term target of 650 750 plus
Also the stock is below intrinsic value
Of 650
Only for education purpose
Consult the experts

Acending traingle pattern for making buy move 🤑Dear traders,
The chart is making a Acending triangle pattern.nn
After breaforkout we can play for a buy move.
But with that we should consider the possible resistance for short term. And possible resistance zone can also make a new breakout point.

SUNTV at Support levelsHey Guys.
Check out SunTV is at Support levels at 528-530.
Lets say on Monday its crossing 529 also we can go bullish till 535-537 Targets Intraday. If it holds bullish hold till 570 Swing Targets
Watch out if Gap down can go till our Trendline support of 520 Directly.
Trade both sides be cautious and go with your instincts.
Do not OVER TRADE.
Happy Trading.


SUNTV Network --Triangle pattern formed and Good in VolumeGood potential for long (at least for 3 months) whenever the candle closes above 571 level.
Stop loss : 535
First Target : 645
Second Target: 684 (when candle closes above 645)
Disclaimer: Please check with your financial advisor and put your analysis before taking any trade.

