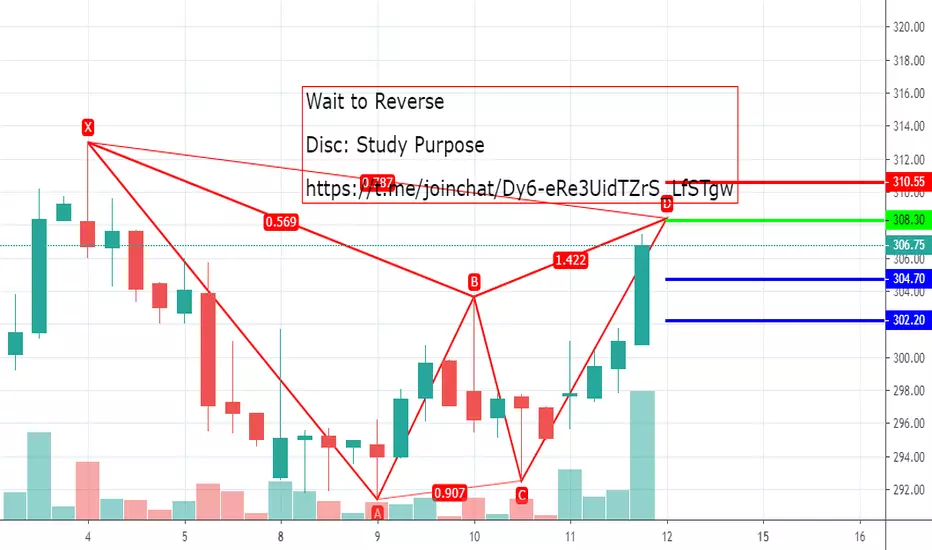
Torrent Power - Bullish GartleyTorrent Power retraced from golden ration but it may come down till PRZ 304 ... Targets on chart..
TORNTPOWER trade ideas


BIG RESISTANCE AHEAD NEED TO CLOSE ABOVE 350 AND 357 IN DAILY OR WEEKLY CHART FOR NEXT BIG MOVE !
AS OF NOW NO BUY IN CMP !

Torrent Power is treading down and form inside candle#TORENTPOWER is week and treading down and looks week in technical parameter.
Showing Bearish result in Technical Parameter:
CCI is treading down
RSI is treading down
Stoch is treading down
DI- is trending UP from DI+
----------------------------------------------------------
Support : 307.20 and 300
Breakdown : 312.80
LTP : 317.70
Breakout : 322
Long Target : 324.60 and 331
----------------------------------------------------------
Positive & Negative Point:
1) Bearish in Daily chart.
2) Bullish in Weekly/Monthly chart.
----------------------------------------------------------
(Disclaimer: This is only for educational purpose and paper treading. Learn and take advice from you financial advisor)


Torrent Power - Trendline tradingStock has broken a trendline with a huge bear candle with good volume on intra -charts.
higher Higher, higher low Structure of the stock is still maintained.
Stock has support around 327 levels , it is the levels from where stock has given the breakout and also retest it before rallying, hence it is important to see how price action will unfold around these levels.


TORNTPOWER - GO SHORT @ 261 FOR A RR OF 1:9 BY MID-AUGUSTTORNTPOWER - GO SHORT @ 261 WITH A SL OF 374 AND A TARGET OF 243. TARGET SHOULD BE ACHIEVED BY MID-AUGUST 2020

TorntpowerLook good for long once get BO , volatility contraction observed.
once breakout happens expected target of 325+


TORRENT POWEREnter above 353 with same as the sl for the target of 369, it near 52 week high which is 347, can be entered at this level too, but then sl would be a bit deep.


TORRENT POWER /BEARISH TARGET (321/314)RSI: showing divergence (showing bearishness)
also price is trading near 21 EMA, filling up gap (price & EMA). IF price closes below EMA 21 and also closes below trend line..stock will break


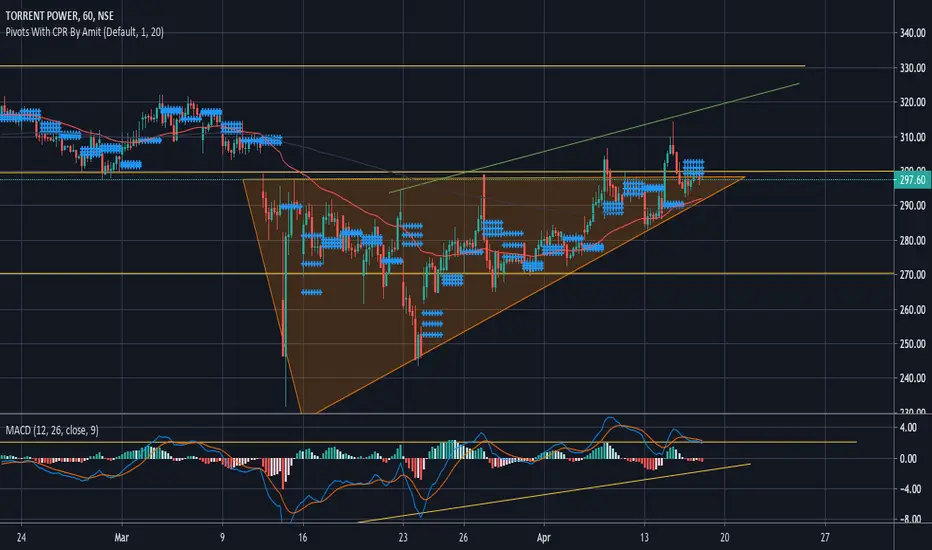
Torrent Power (Range Bound or Ready for a Breakout ?)Torrent Power has been trending higher recently following the general market trend. After forming a low at 230-240 levels it is again at its 2 month peak zone. The yellow lines are formed based on Daily time frame and the green line is for the Hourly time frame. The lines showcase the area of Support or Resistance.
It gave a breakout twice from the Triangle formation only to retrace back, However to support the bullish sense the price has been making Higher highs and Higher Lows. It stands at a juncture where it might make or break the ongoing trend.
After a Quiet day today the CPR is meant to contract for the following day i.e Friday and same will be the case with Indices, So a certain trending day can be expected. And if that would be the case we can expect Torrent Power to give strong moves. An Open above tomorrows CPR would be a supporting signal for the Bulls.
However the MACD has just broken towards the downside of its trend line which might a thing to watch in trade tomorrow.
Taking the recent volatility into consideration and the wild moves that Torrent Power has given which side will you be looking to bet on tomorrow ?
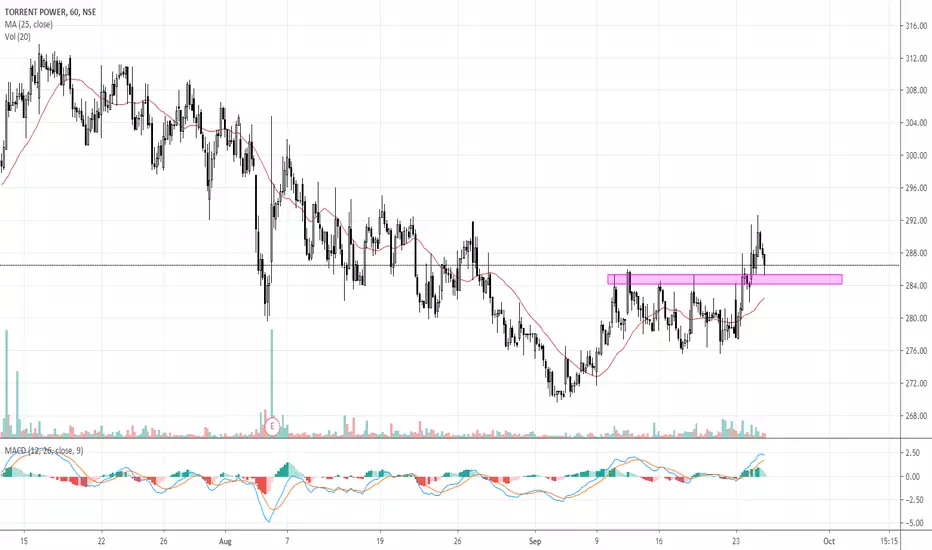
TorntPower Long (Preliminary Analysis)Based on Market sentiment there is a long bias being observed in the stock. Daily key levels are marked with the blue breach of which can initiate a fresh trend. While the yellow zones are respectively the immediate demand and supply zones. Constricted CPR suggests a strong trend in the following trading session. Lastly, the volume squeeze seem ready to be enthralled to support the momentum built up.

TORNTPOWER - GO SHORT FOR A RR OF 1:7TORNTPOWER - GO SHORT @ 335 WITH A SL OF 350 AND A TARGET OF 235 BY JULY 2020

Technical Analysis Class-Rounding Bottom Chart Pattern BreakdownDaily Chart Observations
Point no.1-Resistance–
1) Previous swing high resistance.
2) Trend line resistance.
Point no.2-Support-previous swing low support. Now the price has broken the support area.
Point no.3-Rounding Bottom Pattern– Bearish Pattern
Point no.4- Double top Chart Pattern – Two tops at the resistance area.
Point no.5-Breakdown–
1) Price breaks the double top pattern
2) Price breaks the rounding bottom Pattern
Conclusion
From the above chart, it is clearly seen that there is a structural breakdown and price is trading below the important pattern. So there is a high probability of a further down move
Learn and Improve Technical Analysis
Visit marketsolutions.in
Disclaimer- This post is for educational purposes only, our view is, to teach technical analysis only. we are not recommended to use this analysis for the purpose of trading. once again this is an educational forum only.

SHORT TORRENT POWERSHORT TORRENT POWER
CONDITIONS
1. PRICE SHOULD BREAK 294
2. THEN PRICE SHOULD GO NEAR TO 300
SHORT AT 300-305 (OBSERVE 1HR CANDLE)
FIRST TARGET 277 ... SECOND TARGET 266
STOP LOSS 313.25
USE TRAILING STOP LOSS THEREAFTER
ONE TO TWO WEEKS TRADE. THESE ARE SPOT PRICES.
ALL THE BEST
NOTE: ABOVE TRADE IS FOR EDUCATIONAL PURPOSE. PLEASE CONSULT YOUR ADVISOR.

Trade 15 BV SETUP: Short below 257.5(1h cls) SL260.4.T1-255.2BV Setup
This only for Educational purpose.
