Bitcoin sellBitcoin has made another lower high, now is the opportunity to sell with the stop loss just above the last high
BTCUSD trade ideas

BTCUSD LongDocumentation of My Mistakes and Look back to Laugh at Myself and Be Proud that At Least I started and Stuck to it!

Bitcoin on a bearish trend but shows potential of a reversalBitcoin is currently on a confirmed bearish trend as it made an M formation with a support of about $67 000 and resistance of about $71 900, this is a confirmed bearish trend because it broke through the support and retested however, it still has not reached the lowest point of the last bullish start point which was $56 591 so that is the point where it is headed where it will make another support,likely to make a reversal at that point turning to a bullish trend that is likely to go through the ATH of $73 832, so dont be afraid to buy the coin as it goes down, you will thank yourself for the risk you have taken

Bitcoin price prediction, looks like its going to drop to a suppBitcoin looks like its heading for a support of $56 300, dont be afraid to keep buying the coin though as it showed potential of going up in the last weeks when it was triggereing the all time high of $71 000. It is simply giving investors a chance go maximise their profits because next time it shoots up to $70 000 it might go past the ATH going even over $80 000, watch how other investors predicted the price some of the most sensational investors predict it might even go over $100 000 so don't be afraid to buy the coin, you'll thank yourself later for the risk you took

LONG X 50 HIGH PRECISION ODER FLOW TRADINGBTC futures leverage x 50 LONG
Entry Point : USD 64700
Goal : USD 70000
Stop Loss : USD 64100
Stall Brake : ??? USD
Leverage is extremely risky and must be executed with money that we are willing to lose or hit the stop loss.
Trading is the only profession in which the only person responsible for our actions is ourselves, our worst enemy is ourselves, here there is no one to blame, this is not a collective work, the only one who presses the sell button buy and know how much you invest and where to put a stop to losses, it is you, and only you, so always remember that.
Important note: THE LEVEL OF LEVERAGE OR LEVERAGE, the alert for taking early profits, loss stop adjustment and forced operation closure are not done by this means.
And also remember to always have control over your losses, focus on this and you will last.
Comment: WARNING!!!!
I AM NOT A FUTUROLOGIST, I DO NOT MAKE PREDICTIONS, I DO NOT DO ANALYSIS,
I AM 100% A MARKET OPERATOR, I WORK BASED ON MY EXPERIENCE, CONSISTENCY AND MY PLANNING IN TRADING.
Leave a comment that is helpful or encouraging. Together we can dominate the markets.

Crypto & Portfolio market are in the endo f B waveAccording to my waves count the market top was in November 2021.
Decline belowe 44k will confirm we are in C wave. The target of wave C might be at least 18500k.
However, the structure of this formation may have a more complex form. This may turn out to be a Zigzag. The exit from such a zigzag may last until 2028.
This scenario is canceled if the price closes above 74 thousand

Bitcoin Forming a Double Zigzag (WXY) for Wave 2
We can count a zigzag down and a zigzag up, implying that we should still have one more push down, likely another zigzag, before the end of wave 2.

New ATH in augustIf my idea is correct we are about to bouncing and retest ATH, and we're about to hit the inflection point. TA is showing levels of support that have not been broken yet, and show that we could hit a break out soon.
From a chart perspective we see an ascending triangle forming roughly at the end of a reverse head and shoulders. meaning the bounce of the shoulder should meet and test the neckline.
TA might just be astrology for men, but if it can be 60%+ accurate than it could be worth taking a bet on this position going long and setting a stoploss at 64k roughly. just be weary because in choppy markets you can get wicked out.

Elliott Wave Analysis on Bitcoin (BTCUSD)Elliott Wave Analysis on Bitcoin (BTCUSD)
Wave (I) and Wave (II) on Weekly Time Frame
Starting from the beginning of the Bitcoin chart, the first significant move up in price has been labeled as Supercycle wave (I). This wave represented the initial major bull run in Bitcoin's history, culminating in a peak, followed by a corrective phase, labeled as Supercycle wave (II). This corrective wave ended at the low observed in November 2022.
- Supercycle Wave (I): This wave exhibited impulsive characteristics with five clear subdivisions (waves 1, 2, 3, 4, and 5).
- Supercycle Wave (II): This was a corrective wave, taking the form of an ABC correction, and concluded in November 2022.
Wave (III) on Weekly Time Frame
Since the low of November 2022, Bitcoin has been unfolding Supercycle wave (III). This wave is expected to be a major bullish phase, often characterized by strong upward momentum and significant price increases. Wave (III) typically shows the following characteristics:
- Strength and Momentum: Wave (III) is usually the longest and most powerful wave in a five-wave cycle.
- High Volume: Accompanied by increased trading volume, indicating strong market interest.
- Impulsive Nature: This wave should subdivide into five smaller waves on a lower time frame, confirming its impulsive nature.
Subdivisions of Wave (III) on Daily Time Frame
Within the context of Wave (III) on the weekly time frame, we are currently analyzing the subdivisions on the daily time frame. The current structure suggests the following:
- Wave ((1)) of Wave (III): This wave is unfolding and subdividing into five smaller waves.
- Wave (1), (2), and (3) of ((1)): These waves have been completed.
- Wave (4) of ((1)): Recently completed around April 2024.
- Wave (5) of ((1)): Expected to breach the all-time high to confirm the start.
Current Status and Invalidation
- Current Status: Bitcoin is potentially in Wave (5) of ((1)) of Wave (III), which needs to breach the all-time high for confirmation.
- Invalidation Point: If the low of April 2024 (where Wave (4) finished) is breached, this would invalidate the current count. It would suggest that Wave (4) is still unfolding, possibly as a double correction.
Characteristics and Structure of Wave (III)
1. Wave ((1)): Typically the smallest wave but should be identifiable as a five-wave move.
2. Wave ((2)): A corrective wave, usually retracing between 50% to 61.8% of Wave ((1)).
3. Wave ((3)): Often the largest and most powerful wave, usually extends to 161.8% of Wave ((1)).
4. Wave ((4)): Another corrective wave, typically shallow, often retracing 23.6% to 38.2% of Wave ((3)).
5. Wave ((5)): Completes the impulse sequence, may extend or truncate but should be a five-wave move.
Conclusion
The Elliott Wave analysis on Bitcoin (BTCUSD) indicates a bullish market ahead, driven by the development of Supercycle wave (III). This analysis is based on the assumption that the low of April 2024 will hold, confirming the end of Wave (4) of ((1)) and the start of Wave (5) of ((1)). If this low is breached, the market might still be in Wave (4), unfolding as a double correction.
I am not Sebi registered analyst.
My studies are for educational purpose only.
Please Consult your financial advisor before trading or investing.
I am not responsible for any kinds of your profits and your losses.
Most investors treat trading as a hobby because they have a full-time job doing something else.
However, If you treat trading like a business, it will pay you like a business.
If you treat like a hobby, hobbies don't pay, they cost you...!
Hope this post is helpful to community
Thanks
RK💕
Disclaimer and Risk Warning.
The analysis and discussion provided on in.tradingview.com is intended for educational purposes only and should not be relied upon for trading decisions. RK_Charts is not an investment adviser and the information provided here should not be taken as professional investment advice. Before buying or selling any investments, securities, or precious metals, it is recommended that you conduct your own due diligence. RK_Charts does not share in your profits and will not take responsibility for any losses you may incur. So Please Consult your financial advisor before trading or investing.

all you need to knowSpeaks for itself. No need for boring talk about waves, fibs, wyckoff etc. This single signal works always.
Good luck.

Bitcoin: Soon to Break 90k Equilibrium PointUnveiling Bitcoin's Macro Trajectory: A Data-Driven Approach
This analysis takes a long-term view of Bitcoin's potential, leveraging Goldbach's Conjecture (PO3 number 177147) to identify key accumulation and breakout zones.
Past Performance Informs Future Potential:
June 2022 – March 2023: A prolonged consolidation period aligns perfectly with Goldbach's Order Block zone, suggesting a period of strategic accumulation.
Catalysts Fueling the 2023 Surge:
August 2023 – January 2024: Speculation surrounding ETF approval, AI integration, and rising institutional involvement fueled a significant rally, creating a "liquidity void" within Goldbach's levels.
Current Market Positioning: A Discount Opportunity?
Despite recent gains, the current price remains within the "Bargain and Range" (BR) zone, well below equilibrium levels (estimated at $88,437-$90,000). This suggests a potential discount window for long-term investors.
Predicting the Next Move: A Data-Driven Approach
If Goldbach's framework holds true, Bitcoin is poised for a significant upswing, potentially reaching $99,000 near the "Mitigation Block" (MB) in the near future.
Conclusion:
This data-driven analysis offers a unique perspective on Bitcoin's macro trajectory, highlighting potential buying opportunities and future price movements based on historical accumulation patterns and Goldbach's Conjecture.
Further Reading: Goldbach Trading Basic Guide
This guide introduces the basics of Goldbach trading, a technical analysis method that uses Fibonacci numbers (specifically powers of three) to define price action in financial markets.
Key Concepts
Dealing Ranges: Goldbach theory suggests that price movements occur within predefined price ranges based on powers of three. These ranges are fractal, meaning they exist on all timeframes.
PDAs (Premium Discount Arrays): These are zones where price is more likely to find support or resistance. Goldbach defines specific locations within a dealing range for these zones.
Rejection Block: Area where price is likely to be rejected.
Order Block: Area where large orders are placed, creating support or resistance.
Fair Value Gap: Price gap that is likely to be filled.
Equilibrium: Price level where buying and selling pressure are balanced.
Algorithms: The instructor mentions two algorithms (Algo 1 and Algo 2) for entering and exiting trades based on Goldbach principles.
Benefits of Goldbach Trading
Precise Entry and Exit Points: Goldbach aims to identify high-probability entry and exit zones based on predefined price levels.
Improved Risk Management: Knowing potential support and resistance areas can help traders manage risk more effectively.

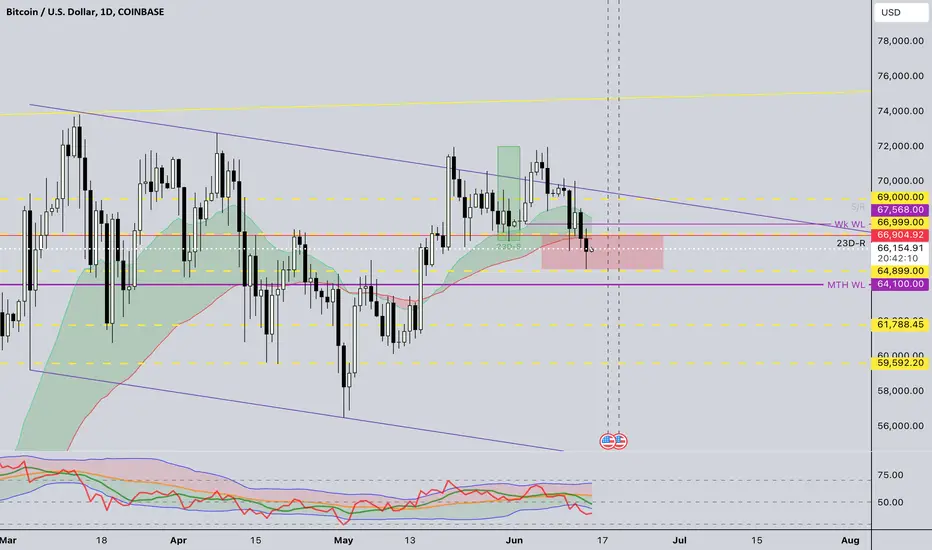
Buyers Defending BTC at $65000Buyers are defending BTC at $65000 levels after a break of HS at $67000 levels. $65000 level was tested ones on 16 May 24 and recently 15 Jun 24. It was also 1 Apr 21 ATH. If broken, more to the downside.
BTC-USD | 4H | SHORT | TECHNICAL CHARTHello traders, there are very few successful people in this business. Please do not believe or trust every trader and chart that comes your way.
I have set my target on the chart. Those of you who know me know that my targets will always reach their target. Drawings are very important in this business. If you make the right drawings, you will reach your goals.
Dear friends, I think there will be purchases from the BTC fibonacci 0.618 level.
But if you want to receive continuous updates under this post, there must be at least 50 likes.
Thank you to all the traders who support me by like.
I wish you a happy trade.
Regards, Love.

Bitcoin Continuing Micro Wave C of Y
Bitcoin should continue declining until we can count five waves inside micro wave C. However, as prices are already closing in on the potential targets of 50% or 62% retracement, if any trade is entered now, it should have a low reward-to-risk multiple to avoid prices turning around before your profit target is hit.

BTCUSD Potential Bullish Bat PatternOn the daily chart, BTCUSD has formed a double top pattern, and the short-term bearish trend is dominant. At present, we can pay attention to the support near 66000. If it falls below, it is expected to fall further, and the downward target is around 61500. When BTCUSD reaches 61500, we can pay attention to the potential buying point of the bullish bat pattern. At the same time, this position is in the previous demand area.

Market Makers in Crypto: Who Controls the Cryptocurrency Market?Functions of Market Makers
Market makers perform several essential functions in the cryptocurrency market, including:
Providing Liquidity: They ensure there is enough liquidity between buyers and sellers to maintain active market participation.
Providing Quotes: They offer bid and ask prices at any given time, facilitating trades between market participants.
Risk Management: Market makers manage trading risks and maintain a balanced risk-return ratio to protect their interests and those of their clients.
Providing Advice: They supply market information and analysis to assist clients in making informed trading decisions.
Improving Market Efficiency: By reducing the spread between buyers and sellers, market makers enhance overall market efficiency.
Market makers in the crypto industry operate similarly to traditional market makers. They provide market liquidity, execute buy and sell orders instantly, and earn profits from the spreads between these orders. However, due to the relatively unregulated nature of the cryptocurrency market, there is no stringent code of conduct for market makers, and the technical demands for ensuring transaction security are higher.
Market makers follow a simple principle: "buy low, sell high." This approach requires handling large volumes of transactions, sometimes up to tens of thousands per second. They use advanced algorithmic programs to monitor numerous parameters and recalculate forecast prices multiple times per second, thus providing market liquidity without incurring losses. Despite this, even sophisticated trading algorithms can falter due to rapid trade speeds or incorrect price predictions. During periods of high volatility, market makers might incur losses while trying to stabilize the market. Therefore, a stable or slightly fluctuating market is ideal for them, while days with significant price movements can lead to substantial losses.
In essence, while regular market participants react to past events, market makers anticipate future market movements to set optimal buy and sell prices and determine order volumes.
Cryptocurrency exchanges and market makers often collaborate closely. Some exchanges maintain their own market-making teams, while others partner with third-party market makers. This cooperation can take two forms:
Direct Cooperation with Crypto Exchanges: Exchanges offer special programs for market makers, providing personalized trading terminals. Through APIs, exchanges share order book information and market depth with market makers, facilitating pricing and matchmaking.
Indirect Cooperation with Crypto Exchanges: Market makers provide over-the-counter (OTC) market-making services through intermediaries or platforms.
Market makers are crucial but not mandatory for liquidity provision on crypto exchanges. They must negotiate terms such as commission distribution and trading volumes with exchanges to ensure profitable and smooth cooperation. Additionally, they must adhere to exchange rules and external regulations to ensure legal compliance.
From a trading mechanism perspective, market makers with internal exchange connections play a significant role in price determination, which can help prevent price manipulation to some extent. Their presence enhances exchange liquidity, improving user experience and loyalty, and making the exchange more profitable. Consequently, exchanges often offer discounts to market makers for their activities.
✅Disclaimer: Please be aware of the risks involved in trading. This idea was made for educational purposes only not for financial Investment Purposes.
---
• Look at my ideas about interesting altcoins in the related section down below ↓
• For more ideas please hit "Like" and "Follow"!

BTCUSD tripple TOPMonthly chart.
Tripple TOP.
Possible correction to 44.000 usd.
Price below 44.000 usd means that we are going more down to 30.000 usd.
Everybody is now bullish (if you look at charts on tradeview). Every one on youtube is screaming that the price is goin to 100-150.000 usd.

BTC UPDATE HEADING TO 59.6k minimum?!bitcoin is in a downtrend and the daily chart shows some interesting developments. we have 2 fair value gaps one at 64.5k - 63.1k which lines up with my wave 3 target which is the 1.618 level of wave 1 measured from top of wave 2. We have another fair value gap at 62.5 that extends down to 59.6k which is significant and will probably be filled. this would be my wave 5 target.
If the bulls cannot hold the 59.6 level we will drop to 54.5 fast as there is another fair value gap there. good luck to the perma bulls honestly i dont think we are going to be seeing a new ath before we see 56.8-52.1k
Let me know what you think, i finally became a profitable trader and so i feel confident enough to share my analysis as I am new to posting. i would love to hear what you think.

Short term SHORT Downtrend market structure in confluence with 61.8% fib levels and downtrend line support
Wait for double top on the M15 timeframe
#enjoytheprocess

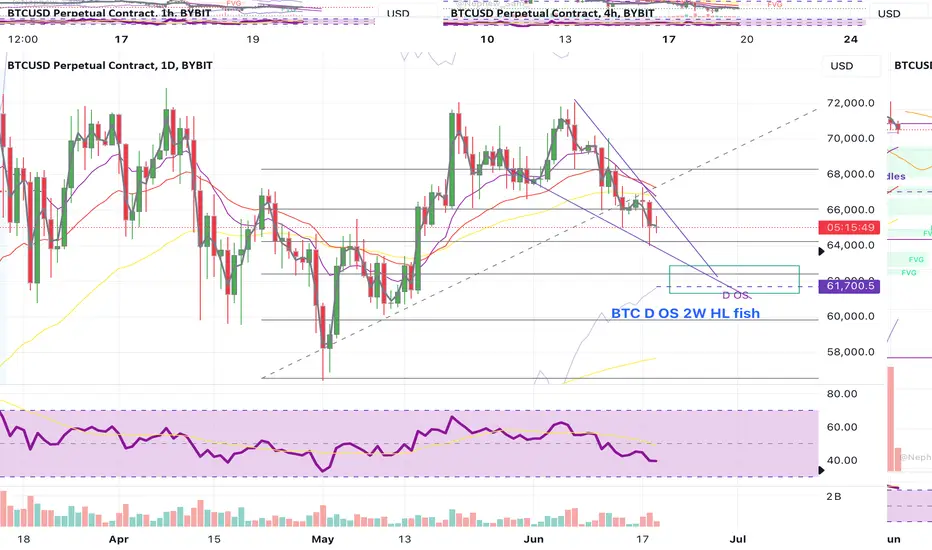
BTC keep it simple - play RSI Daily Oversold for the 2 week HLThis is the trade to focus on . B TC is currently grinding down the D and 4 H ema 12.
Wedge trading can be fun but a lot of work.
Better wait for clarity and buy some fear into Daily OS.
2 Week Higher low is the most likely scenario .
Also make a List of the strongest ALTS that you wanna play for the bounce.
mine is :
ETH ; PENDLE , UNI; MKR
Simple Bitcoin analysis (Long Term) Higher no matter what?Let's keep things simple on a daily since the chart patterns seem to make the most sense here. As you can see when Bitcoin formed a double top on the daily it was all downhill from there. Now it is forming a cup and handle pattern on the daily time frame - So it will most likely just be massively up from here. Don't say I didn't warn you that the TA should be kept simple when trying to guess long-term moving averages. Pay attention to the support line I drew. BTC will never go below this line. If it does I will delete my account.

ı think this pattern can be occurı thind head and shoulder pattern can be occur and this stiation price will be increase but ı am not sure

LONG X 50 HIGH PRECISION ODER FLOW TRADINGBTC futures leverage x 50 LONG ✅
Entry Point : USD 65300
Target : USD 68500
Stop Loss : USD 64700
Stall Brake : ??? USD
Leverage is extremely risky and must be executed with money that we are willing to lose or hit the stop loss.
Trading is the only profession in which the only person responsible for our actions is ourselves, our worst enemy is ourselves, here there is no one to blame, this is not a collective work, the only one who presses the sell button buy and know how much you invest and where to put a stop to losses, it is you, and only you, so always remember that.
Important note: THE LEVEL OF LEVERAGE OR LEVERAGE, the alert for taking early profits, loss stop adjustment and forced operation closure are not done by this means.
And also remember to always have control over your losses, focus on this and you will last.
Comment: WARNING!!!!
I AM NOT A FUTUROLOGIST, I DO NOT MAKE PREDICTIONS, I DO NOT DO ANALYSIS,
I AM 100% A MARKET OPERATOR, I WORK BASED ON MY EXPERIENCE, CONSISTENCY AND MY PLANNING IN TRADING.
Leave a comment that is helpful or encouraging. Together we can dominate the markets.
