BTC: 7955 | Oct. 19, 2019 Sat - May 2020 Planthe float is diminishing while stabilizing coins make it cheaper to acquire BTC relative to mining
the road to 100k ++ should be organic post the HALVING when institutions make a SHOUT OUT above 10k levels again
BTCUSD trade ideas

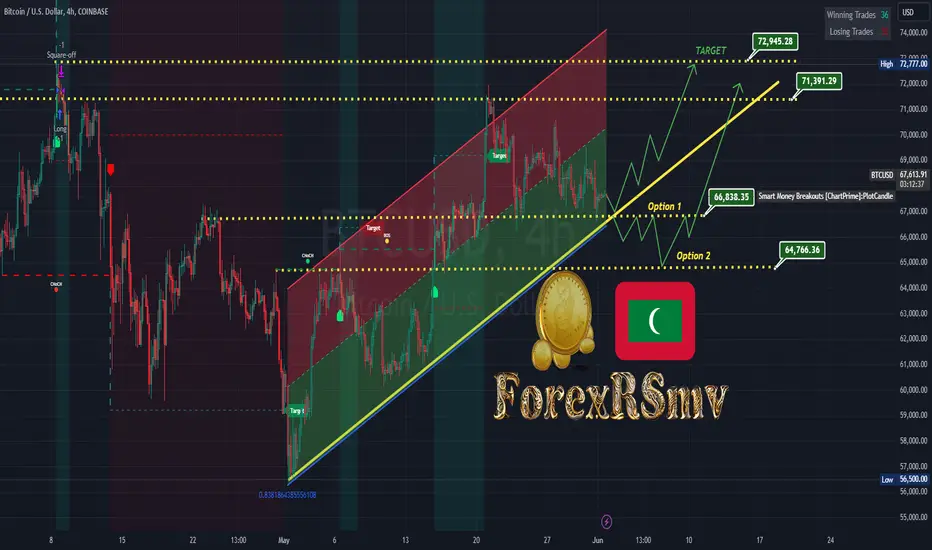
BTC may encounter resistance callbackYesterday, BTC broke through the important resistance level of 70270 in the previous oscillation range. The current price has risen to the 71340-71960 range. If the price cannot break through the upper limit of the range of 71960, it may usher in a sharp correction.
Radicals can sell in the 71340-71960 range, with a target of 70200-70500
The above trading suggestions are for reference only. I will update the market analysis in my guidance group at any time

A BULLISH SCENTThe Pressure on 72K is accumulating power for a gravitational breakthrough for the crypto Indutry.....BRIGHTSON

"Consider purchasing BTCUSD now at 68506 "Consider purchasing BTCUSD now at 68506 for potential gains. Our recommended target prices are: TP1: 68587, TP2: 68987, TP3: 69787. To manage risk, set your stop loss at 68000."

Bitcoin makes good profit. Now is just the beginning!!! UPDATE2Bitcoin is an invention designed to grow forever as long as we live.
If you see the same vision, don't forget to support the analysis.
I'm releasing UPDATE2 earlier than planned because today the channel reached *666* followers. The analysis is set for long-term updating.
It doesn't matter if the price is 70k or 50k as long as you see the big picture.
The world economy is still uncertain, we are hiding in cryptocurrency.
I prepared the analysis in a logical circle with altcoins!!
My analyzes are 100% my own and not manipulated by other people's opinions, I don't follow anyone here.
i could be wrong but this could be absolutely true.
I believe my truth, MoralDisciple

BTC to 75K then 80KBULL FLAG launch of Bitcoin should see a fast leg up to 75K then I see it coming back and testing ATH then going higher to 80K. I expect this move to be coming very soon. Using Channels, Fibs, And Elliot waves I show how I expect Bitcoin to launch here shortly.

BTC to follow and complete consolidationI believe btc will continue with the pattern its been following and progress further downward in the near future.

$BTC longer term view. New lows? Or new highs?If we haven't already topped, I think the upside is limited here. Price is currently at $71k and if we get a move higher, I think price would top out at $ 78k-$ 81k for this cycle.
I see a few different scenarios from here that can play out.
1. Price tests $ 48-52k from here, we rally quickly from there but then roll over and see new lows below where we went in 2022.
2. Price tests $ 48-52k from here, we rally quickly from there and we end up seeing a new high between $78k-81k. Then price falls after that to new lows below the 2022 low.
3. Price blows past the $ 81k resistance and we continue up (less likely in my opinion).
I think all risk markets are heading into a correction phase here and bitcoin won't escape the drawdown IMO.
I think this will end up being "a black swan" event.
Sharing this idea because most don't think this is even a possibility, but to me, it's my base case.
Cautious heading into the back half of the year.

BTC update in H4 chart Hello
There is nothing more to say about BTC and please check lest ideas. This is just an update for its new wave counting
Thanks


100k for this summer! Always greenBitcoin is designed to grow forever and works like the US500 but only with higher volume.
BTC volume is incredible and I won't be surprised if we see 100k++ within 3 months or summer.
3-17 June 2w closes in green!!
More details on the MD channel or in future updates.
I wish you success and see you at the top! MD

BTCUSD - Topping out around 66k?BTC is yet to fully correct, at least on the weekly. In my eyes, these huge candles up are unsustainable without significant greed. Significant greed cannot continue indefinitely without returning to the mean (neutrality), and likely, significant fear.
There are a few factors I believe will influence a correction:
Greed across the traditional and crypto markets. See CNN's sentiment analysis and alternative.me's fear and greed index.
Only 5% of institutional financial managers are planning to hold BTC in 2021 (volatility being cited as the main reason), implying the feverishness of 'mass adoption' is overstated and overhyped.
Bitcoin is back in mainstream media. The more exposure it gets, the more FOMO and greed kick in, the more new investors pile in, the more people ready to buy right at the top and add selling pressure on the way down.
Big green (or red) candles, while difficult to gauge the top, often result in big moves back down. Similarly, an almost vertical acceleration implies a significant deviation from its mean (anecdotally, the further and quicker something deviates away from its mean, the quicker it comes back). Currently, BTC's yearly EMA is almost exactly the previous ATH of $20k.
Simply, a correction is due. It's gone up but hasn't come down much.
So, knowing that a correction is due at some point, we can then try and forecast the top.
While looking for similarities between the last ATH and this current rally, I noticed there was a period of consolidation, followed by a higher low that wicked down (marked on the chart).
Using these points as anchors, the next anchors are the ATH and the last high at $42k. While the intraday levels of these fibs fit nicely, there are 2 extensions that caught my eye on the weekly that fit almost perfectly.
The 1.618 level on the recent fib (grey) and the 3.618 level of the ATH fib (red) both sit around $66.1k and $66.3k respectively. Seeing how well the other levels line up through previous price action gives me confidence these are valid levels. I'll give coordinates at the end of this post so you can see what I mean.
I've also included a 3-factor BB on the chart for confluence. While the weekly close tomorrow will change the upper band, its near-vertical ascent will likely eventually be punctured by price. As denoted by the red circles, a reversal has occurred every time a swing has formed there. Moreover, for an asset to exceed 3 times its weekly standard deviation should ring alarm bells in anyone's ears.
Okay, so we know where the top might be. How can we make a trade based on this? I'll start with where I think it might end up.
If we use $66k as our first anchor and the bottom of the last consolidation at about $3.1k, then the 0.618 level (blue line) lines up perfectly with the most recent fib's 0.618 level on the way up. This falls at $27.5k, or rather, a contraction of 61.8%.
The tricky part is stop loss placement. I'm going to say that a technically invalid level would be past the 3.764 level of the ATH fib at $70k. Anything between $71-72k would likely invalidate this idea.
In summary:
Entry: $65k
Stop: $71-72k
TP: $27.5k, $31k if conservative, $42k if ultra conservative
Let me know what you think and give me a follow for more.
Happy trading!
COORDINATES:
ATH fib = (1) 1830.00, (2) 19666.00
Current fib = (1) 3122.28, (2) 42000.00
TP fib = (1) 66026.19, (2) 3122.28

BTCUSD massive short signals appearbtcusd is trading at the price of67634 today, new month and new week has got triggered some of the strongest sell signals , could this be 32k incomming ,or we could stay in this accumulation zone untill beginning of the bussiness week

Bitcoin cycles since 2011Each crypto cycle lasts about 4 years. The tops and bottoms of these cycles show striking similarities, often following a pattern that has repeated over the years. This isn't just coincidence—there are underlying factors that contribute to this consistency, making it vital to recognize these patterns in your trading strategy.
If history repeats itself, we are looking for this cycle to top around 20 Oct 2025 with next low around 14 Sept 2026.
It will be a wild ride. Buckle up!

BTCUSD IDEAThe price is still in consolidation.
Now we need to watch for the reaction to the mentioned area :-
(66838-66000-64766 Support ).
If the bulls hold, then the price will head towards the resistance. But, most likely, the market has not yet accumulated the proper potential and the price may go deeper and test the support at 64500 before going up.
But, there is no talk about a crash or a global fall now.
BTCUSD SMALL RISK ENTRYI cancelled the previous short position and put a limit on the chart above. Just my own analysis
TYOR!!!

BTCUSD BUYMarket sweeps PDL with strong displacement to the up side with MSS and IMB and breaker entry at the 50% of IMB and target 1:2RRR lets see how it goes

Bitcoin - Upside potential of 22% to 38%I'm looking at the Elliott Wave structure here and using the Fibonacci retracement and projection tools to determine the most likely resistance zones.
Why? Because it's clear by now that price is consolidating and a new move higher is about to come (depending on your trading style, the rise has already started).
So, I don't think the question here is IF bitcoin will go higher but rather WHEN.
Chances that this will collapse before we see a new high first are low in my humble opinion.
(low =/= zero, so always use a Stop loss!)
(Personally I bought BNB yesterday which in hindsight was not a bad idea, 🍀! ).
So, back to our upside targets.
First off though,
The measures shown here are valid ONLY IF my minuette (blue) wave count is correct!
I'm being cautiously bullish and assuming the blue wave count being an impulse with an extended wave (i) of 96% increase and a wave (iii) being 78%.
For those that don't know, the Elliott Wave theory has some very simple rules and guidelines and one of them is that wave 3 can never be the shortest, meaning it can not be shorter than wave 1 AND wave 5! (don't worry about wave 2 and 4 for now).
So, by respecting that rule we can assume that wave (v) must no be more than 78% otherwise this wave count is incorrect and we have to consider a more aggressively bullish view. (look at my previous post about Bitcoin).
So, in that case, the wave count gets invalidated if price goes above 108k.
By measuring different lengths of current rise using the Fibonacci projections and retracements, we get some cluster zones where different measures come together. Those zones, we can expect, are the most likely to act as resistance and that price will slow down and consolidate or simply reverse from those.
(Remember, support and resistance levels are always hypothetical, we can only be sure once they are established!!!)
Here, according to my measures, the most likely levels are
and .
For those who like it, by also studying the expected rise on a smaller time frame coming days, (remember, markets are fractal), we can again use the Fib measures to better pinpoint the potential reversal zone(s) of the move.
Depending on your entry, risk appetite and simply your trading time frame, consider it for yourself if micromanaging the position is worth it.
Thank you for reading my post, hope it's helpful.
PS : sorry if the chart isn't very clear, I'm on the road and don't have my computers with me but wanted to still share my opinion on this one.
PS :

BTC consolidates to 20 EMABTC is slowly grinding down to the 20 EMA here, in a bullish trend the 20 is usually held. The stochastic RSI has now bottomed on the daily but is still pointing upward on the weekly from a recent bottom, this is bullish for expansion. New all time highs did not come in May, but I do think June presents an opportunity, June historically is one of BTCs best months statistically. I think we see 78-79k this month based on those stats and the upholding bullishness. Buyers have been stepping in at these levels. A flush back to 66k flat would align perfectly with the 50 EMA and the bases and tops of the candles I marked with the red ray.

BIG SHORT ON BTC!!!!!!!!!!A hidden bearish divergence is printing on the daily btc chart which means a trend (bear) is likely to continue

Bubble AI Nvidia.Stock ATH...
Warning..
Be careful.
I'm out of the market and i'm waiting now under the sun and with coktail.

Interpreting a Potential Wave 5 in BTC/USDHere's how you can analyze the daily chart of BTC/USD to identify a potential wave 5 uptrend using Elliott Wave Theory:
Confirmation of Uptrend: Analyze the higher timeframe charts (weekly or monthly) to confirm a dominant uptrend.
Completion of Wave 4: Identify the end of the corrective wave 4. It should ideally be shallower than wave 2 and shouldn't breach the bottom of wave 2 in a strong uptrend.
Wave 5 Characteristics: Look for the following signs in the daily chart that might suggest wave 5:
Renewed upward momentum with increased trading volume.
Price surpassing the highs of wave 3, indicating a continuation of the uptrend.
Potential application of Fibonacci extensions, particularly the 1.618 extension applied to wave 3 or the entire wave 1-3 movement, to identify possible price targets for wave 5.
Essential Considerations:
Wave 5 can be deceptive: It might be weaker than anticipated due to profit-taking by earlier trend participants or exhaustion as the trend nears its completion.
False breakouts: Sharp price increases that fail to hold and reverse can trap traders expecting wave 5.
Confirmation is key: Always seek confirmation from other technical indicators like volume analysis, support/resistance levels, and trend indicators before entering a trade.

#Bitcoin could hit $156,000 by May 27 2025! Here's Why!!BTC is trading at %68500 as we speak.
These green boxes represent the price action after #BTC halvings. We've never seen a red year after a halving.
Bitcoin halvings are significant events, here are the percentages of Bitcoin's price increase one year after each halving event to date:
1. First Halving (November 28, 2012)
- Price at Halving: ~$12.35
- Price 1 Year Later: ~$1,037
- Percentage Increase: ~8,296%
2. Second Halving (July 9, 2016)
- Price at Halving: ~$650
- Price 1 Year Later: ~$2,520
- Percentage Increase: ~288%
3. Third Halving (May 11, 2020)
- Price at Halving: ~$8,800
- Price 1 Year Later: ~$56,000
- Percentage Increase: ~536%
4. Fourth Halving (April 19, 2024)
- Price at Halving:~ $65,415
- Expected Price (1 Year Later): $115,000 - $156,000
- Percentage Increase:~ 127% at $156,000!
This return is decent as compared to the previous rallies.
Looking at the bigger picture is crucial if you want to see significant changes in your portfolio.
If you like this content, consider bookmarking it and sharing your views in the comment section.
Thank you!
#Bitcoin
