Bitcoin at the daily target: what comes after 93,092?This analysis is based on the Initiative Analysis (IA) method.
Hello traders and investors!
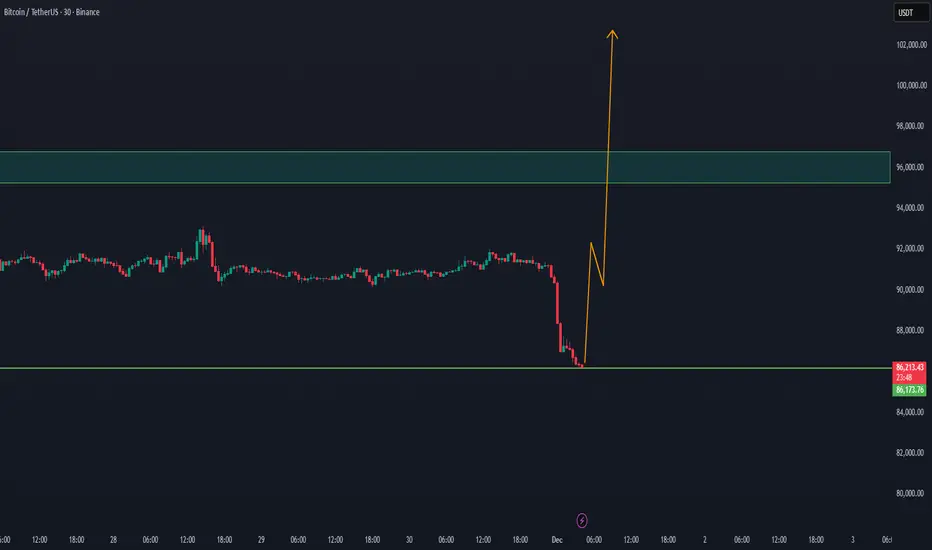
On the daily timeframe, Bitcoin has formed another confident buyer absorption — and this absorption was simultaneously a manipulation (a false breakout) of the 86,116 level.
Notably, the seller’s candle appeared with increased volume, and the subsequent absorption created a new buyer zone.
The buyer target within the current range — 93,092 — is almost reached.
Given the strength of buyer initiative, further movement toward 94,000 or even 97,000 cannot be ruled out.
However, once the price reaches 93,092, it is reasonable to expect seller initiative.
This is classic market behavior near a target: some buyers take profit while sellers get an opportunity to step in.
Wishing you profitable trades!
Trade ideas

BTC Trading Inside a Well-Defined RangeBitcoin continues to move inside a horizontal range with clearly visible zones used by smart money.
🔴 Distribution Zone (sells): 94,000 96,000
This area has repeatedly shown aggressive selling pressure. Smart money hunts liquidity here, taking out short stops and creating short-term reversals. As long as BTC stays below this zone, there is no confirmed bullish breakout.
🔵 Accumulation Zones (buys):
90,000 – 88,500
87,000 – 84,500
These zones show clean, consistent buyer reactions. Every deeper dip gets bought instantly — classic smart-money behavior when building positions step-by-step and defending key levels.
BTC is essentially trading between two zones of major interest.
Top = distribution.
Bottom = accumulation.
This is a typical balance phase before the market chooses a direction.
What matters now:
Price is pushing toward the top of the range without making new lows — buyers still hold the initiative.
But without a breakout above 96K, this remains a range controlled by smart money.
My focus:
Watch who takes initiative at the boundaries
Wait for either a strong breakout above 96K with volume, or a deeper test of the accumulation zones
No predictions inside the range only reacting to clear signals
For now BTC continues to trade in a structure where accumulation and distribution are clearly visible. True decisions happen at the edges.

BTC will drop soon....this is massively manipulatedThis may be related to the potential rate cuts which is being "priced in," but nothing fundamentally is improving BTC position and it still doesn't solve any real problems and will go back to 80k or even lower real soon. Retailers will jump in as exit liquidity and will get wiped out when it drops back from the massive losses taking place. Great to time to get into MSTZ! Easy 5-10% upside IMHO....

$BTCUSD— $85,100–$84,100 Demand Zone Could Spark the Next Rally!BINANCE:BTCUSDT is building a solid bullish structure after a confirmed CHOCH and multiple BOS signals. Price is now approaching the $85,100–$84,100 demand zone, which is the key area to watch for a potential long entry.
If buyers step in and the zone holds, upside targets remain $88,000, $93,000, and $100,000.
A breakdown below $82,100 invalidates the setup and suggests deeper downside.
This demand zone will determine whether BTC continues its emerging bullish momentum. Stay patient and manage risk accordingly.

Bitcoin 1more dipThere is a possibility that after Bitcoin reaches the 99k area, it falls again due to many resistances in that area, and then goes to 110k.

AFTER THE EXPECTED CORRECTION BTC ON WAY TO 100k+WE did expect with the last BTC update that a correction could happen at Bitcoin.
With the new study update, there is a good chance BTC will return step by step to the 100k level
Since the price action, new whale volume can enter BTC.
our previous update with the expectation of BTC fall

Bitcoin 06.12.2025Volume Profile Analysis – How Price Reacted Inside the Fair Value Area
1️⃣ First touch of the Fair Value Area – Price enters the Value Area Low (VAL) and gets rejected immediately. A typical reaction when market participants consider the zone undervalued and push price back into the range.
2️⃣ Second touch – This time the behavior shifts: price no longer shows weakness but instead signals an intention to traverse the entire Value Area. The flow starts favoring a move toward the Point of Control (POC), where liquidity is highest.
3️⃣ Near the VAH – As price approaches the Value Area High, selling pressure becomes visible. A larger entity (market maker or significant participant) finds this zone comfortable to offload positions, creating another downward reaction.
🔎 Conclusion: The sequence of reactions around VAL–POC–VAH suggests controlled behavior from high-volume participants. The key zones remain well-defined, and current reactions may guide whether price continues to expand downward or upward depending on how it interacts with the POC.

BTC — [2D] WEEK 49 TREND REPORT | 12/05/2025BTC — WEEK 49 TREND REPORT | 12/05/2025
Ticker: BINANCE:BTCUSDT
Timeframe: 2D
This is a reactive structural classification of BTC based on the weekly chart as of this timestamp. Price conditions are evaluated as they stand — nothing here is predictive or forward-assumptive.
⸻
1) Current Trend Condition [ Numbers to Watch ]
Current Price @ 89,200
• Trend Duration @ +98 Days ( Bullish )
• Trend Reversal Level ( Bullish ) @ 103,400
• Trend Reversal Level ( Bullishh Confirmation ) @ 103,400
• Pullback Support @ 100,002
• Correction Support @ 79,436
⸻
2) Structure Health
• Retracement Phase:
Correction (approaching 61.8%)
• Position Status:
Unstable (price below both structural layers)
⸻
3) Temperature :
Cooling Phase
⸻
4) Momentum :
Bearish
⸻
Author’s Note
DOWNWARD STRUCTURAL ALIGNMENT
This mark identifies a moment where the market showed clearer alignment with downside direction. It does not predict future movement, but acknowledges where weakness became more evident within the prevailing structure. Its relevance remains only while price continues to hold beneath key structural boundaries.
⸻
Methodology Overview
This classification framework evaluates directional conditions using internal trend-interpretation logic that references price behavior relative to its structural layers. These relationships are used to identify when price movement aligns with the framework’s criteria for directional phases, transition points, or regime shifts. Visual elements or structural labels reflect these internal interpretations, rather than explicit trading signals or preset indicator crossovers. This framework is observational only and does not imply future outcomes.

Bitcoin Analysis | Key Decision-Making Moments!
Hello to all my dear traders! Hope you're doing great.
Let’s jump into our beloved Bitcoin!
Before anything else, I really hope you pay attention to the points I repeat in almost all of my analyses:
Risk management and daily monitoring are the keys to winning.
Don’t ignore Bitcoin Dominance.
Write down your trades and review them.
Trade in the direction of the trend. And if the market—like now—doesn’t have a clear trend, taking too many trades doesn’t make much sense. If you do trade, keep the risk low.
Bullish Scenario »
As expected, we got a reaction from the top zone on the 1H timeframe. I mentioned you could open a position based on BTC dominance—for example, if you had taken BCHUSDT, you could have already hit a 2R setup.
But what’s the situation now?
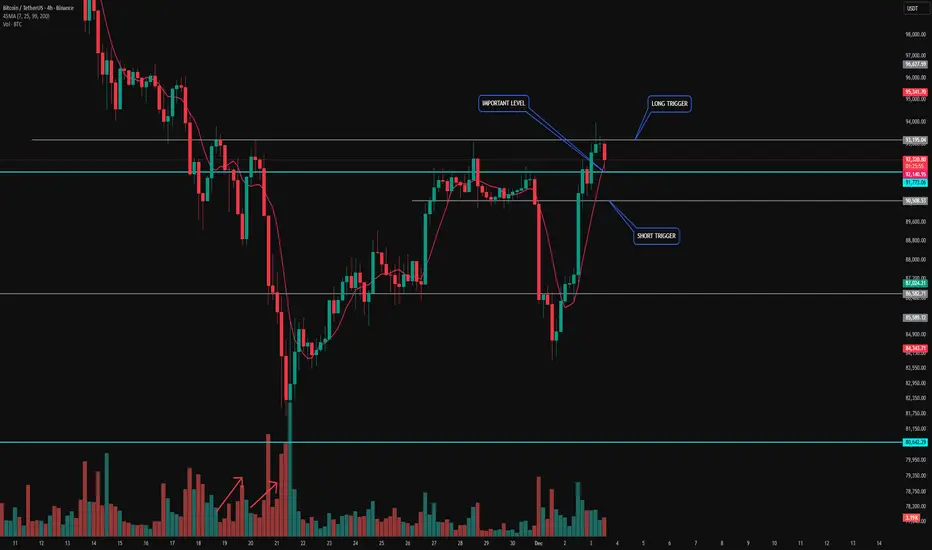
The market has built a nice structure, and we’re just waiting for a long trigger.
📌 My long trigger:
A breakout above 93,195.
If you see rising volume, you can even take the trigger earlier.
📌 What does rising volume mean?
I look for step-by-step / ladder-type volume increases. I’ve shown an example of this structure on the chart—if you see something similar, a long position becomes logical.
After the break of 93,195, I personally will be looking for longs—but I will definitely secure partial profits along the way.
Range Scenario »
If the price falls back below 91,733, the market likely wants to form a multi-week range between roughly 95,000 (top) and 80,000 (bottom).
If that happens, I’ll tell you the timeframe where you can open positions with a tight stop-loss and fast take-profits.
For now, we should NOT see a 4H candle closing below 91,733, because in my opinion that would kill the current momentum.
Bearish Scenario »
Very simple:
📌 90,500 is the short trigger.
Just pay attention to Bitcoin Dominance, and place your stop-loss above the 15-minute structure high.
Make sure you secure profits quickly.
If we get one more strong drop, it confirms that we’re likely entering a weekly range, which will help avoid high-risk situations.
Final Words »
As I told you in previous analyses, this is the first bullish move after a sharp drop, so watch the buyers carefully.
Wherever they show weakness, we can take positions against them, but only with confirmation—and our confirmations are automatically provided once our triggers activate.
Stay safe, stay healthy, and trade smart.
Wish you all the success! 🚀💚
Bitcoin riding long term trendsIt’s looking like BTC is readying for a retest of $100k. Let’s see if the economy continues to expand in January or not.

BTC Reclaims Key Trendline Expecting Bullish WeekendBTC: One More Push to 94K Before Potential Reversal? 📊
USDT.D Elliott Wave Analysis:
Currently tracking Wave B of an ABC corrective pattern on USDT Dominance. This suggests we're in a counter-trend bounce before the final Wave C decline, which historically correlates with one more leg up in BTC.
BTC Technical Setup:
Successfully retested the descending trendline (visible on 4H)
Breaking out of the converging triangle pattern
Target: ~94,000 zone
Timeline: Expecting the move to complete by Sunday night/Monday
Key Observations:
USDT.D showing signs of exhaustion in its corrective bounce
BTC maintaining structure above support
Trendline retest providing confluence for the next impulse move
Trade Considerations:
Watch for momentum slowdown approaching 94K
Monitor USDT.D for Wave C initiation signals
Potential distribution zone forming into Monday session
Risk Management:
This could be the final push before a deeper correction. Consider:
Taking partial profits near target
Trailing stops on remaining positions
Reducing exposure ahead of the weekend/Monday transition

Will Bitcoin Price Under $95,000 Benefit From $2 Billion BuyingBitcoin is trading at $92,047, holding above the critical $91,521 support level while remaining trapped under the month-long downtrend. Recovering from this position requires a decisive breakout, which has yet to materialize despite recent attempts.
Invalidating the downtrend demands a flip of $95,000 into support. Given the ongoing accumulation and tightening exchange supply, such a move remains possible. Additional support from institutional buyers would further strengthen Bitcoin’s path toward $100,000, restoring bullish momentum.
If large holders remain sidelined, Bitcoin may continue to struggle. A failure to sustain support could send BTC back below $89,800 and toward $86,822. This would reinforcing bearish sentiment and delaying recovery attempts.

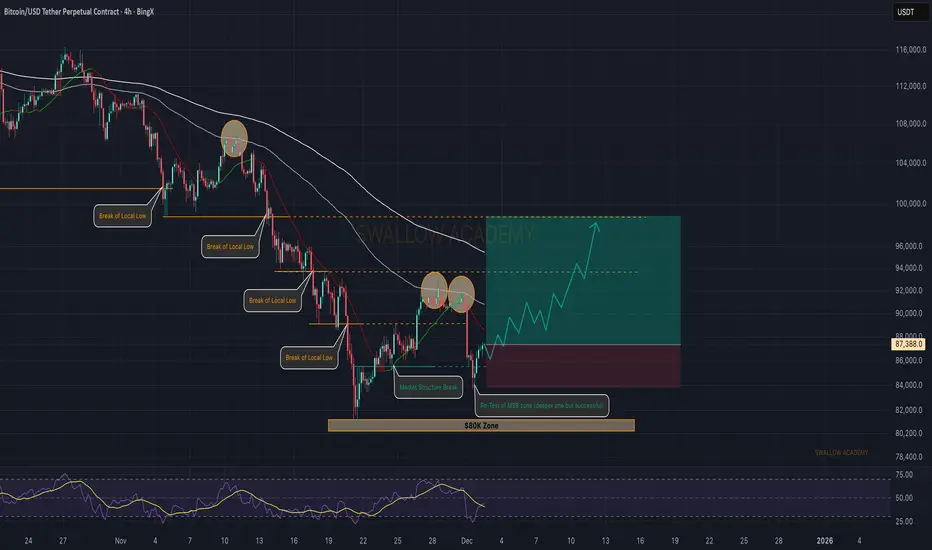
Bitcoin (BTC): Market Structure Break + Successful Re-Test | BuyAfter the deep downside trend we had on the Bitcoin, the price formed a decent market structure break (MSB), which reached the 100EMA and then went for a retest.
Now after the retest we are seeing a decent movement forming and price recovery happening, which can lead the price back to 100 EMA and then possibly break it as well.
Monday was bloody but the rest of the week should be green!
Swallow Academy
Daily bitcoin trade - Fri(Nov-28-2025) - ShortFri(Nov-28-2025) - Short
Lev: 25x
En:90780
Sl: 93390
TP:87885
This is my personal setup — please always manage your risk.
This is not an offer to buy or sell.

Bitcoin consolidation bearish momentumBitcoin continued its consolidation within bearish trend lower price multiple times and decline and price controlled down move i expect deliver bearish trend from the current situation see the bitcoin structure.
Technically Prices fell more than 6% during overnight trading and were quoted just above the 85,000 level early Monday morning on the U.S. East Coast.
Bitcoin has maintained a bearish structure since May, when price action briefly tested resistance near 89,000 before turning lower again. Downside pressure remains as long as price stays below that resistance zone, with key support levels expected around 83,000 to 80,000.
You may find more details in the chart,
Trade wisely best of luck buddies.
Ps; Support with like and comments for better analysis thanks for supporting.

BITCOIN → Retest of the 94,000 zone of interest...BINANCE:BTCUSDT.P is rebounding from its interim low of 80,000. However, it is still too early to talk about a bull market, as a countertrend correction is forming under the current circumstances.
Globally, Bitcoin is in a downtrend, with the zone of interest for a countertrend correction being 94,000-95,000. The market structure is bearish, and a retest of the break-even zone could trigger a downward movement within the trend.
After a strong liquidation to 80K, the market is forming a pullback, which is a basic phenomenon. There is no confirmation of a trend reversal yet, and the fundamental background is neutral, without clear support. Various analytical services suggest that the market is in a cleansing phase and has so far only liquidated short-term traders, reaching a cumulative average break-even price. A classic pullback. Technically, the zone of interest or magnet for the medium-term market is 75K (on the daily timeframe).
Resistance levels: 93,000, 94,000, 97,300
Support levels: 89,000, 86,000
In the current situation: a bearish trend, weak purchasing power, and a weak fundamental background, I consider a pullback to be the primary reaction to the 93-94K zone. However, the market is not constant, and if support appears (news or other drivers) and Bitcoin manages to stay above 95K, then growth can be expected.
Sincerely, R. Linda!

01/12/25 Weekly OutlookLast weeks high: $93,088.10
Last weeks low: $85,279.04
Midpoint: $89,183.57
A brutal start to the week for the bulls here. A -6% move to the downside as soon as the Month of December opens rejecting off the range weekly high. Across the high time frame this confirms a new lower high and a failure to get back within the trend that has stayed consistent throughout this bull market.
All of last weeks recovery bounce has been wiped out in a matter of hours, so now the question is where does the buy side pick up, if at all? FOMC interest rate decision is predicting another rate cut (80% probability) as well as the end of quantitative tightening and the beginning of quantitative easing on paper should bring more liquidity into risk-on markets such as Bitcoin, but that is on a longer timescale.
In the more immediate time frame I think the range broadly $80,000-$100,000 with this weeks range seeing a lot of the noisy PA. Midpoint is a key S/R level to gauge sentiment and conviction, a reclaim of the level may open the door to a stop loss hunt around weekly high but for now the momentum is definitely with the bears.

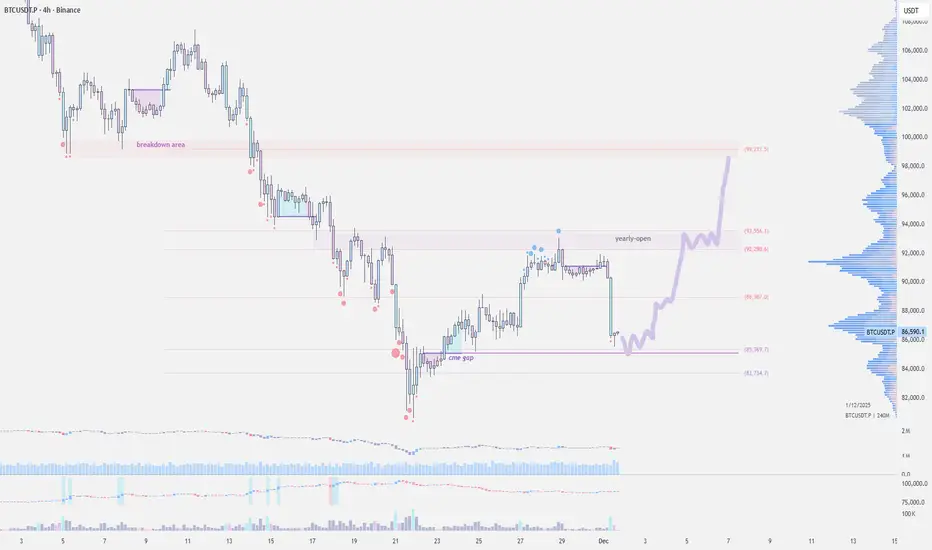
Bitcoin Kicks Off December in the RedCRYPTOCAP:BTC opened the month in red, a strong sell-off slammed BTC from $91.5k to $85k in just three hours.
Bitcoin's recent strength was largely driven by hopes of a December Fed cut, but this move looks more like the market finally cooling off after running overheated for weeks.
Now price is trying to stabilize around the $86k support near the CME gap. There are early signs of a bounce, and if buyers defend the 84–86k zone, a move back toward the 94–95k breakdown area is possible. If that support gives way, expect another dip or continued consolidation.
Trend Exhaustion: How to Spot a Reversal Before It HappensReversals rarely start with dramatic candles. They begin quietly, through subtle shifts in momentum and structure that most traders overlook.
A strong trend doesn’t collapse all at once. It loses strength in stages, and those stages are visible long before price turns in the opposite direction.
The first sign of exhaustion is weakening impulse strength. In a healthy trend, impulsive moves are clean and decisive, and retracements are controlled. When each new push produces smaller higher highs or lower lows, it signals reduced participation.
Buyers or sellers are still present, but the force driving the trend is fading.
The second clue lies in how price interacts with liquidity. Strong trends break key levels with conviction. Exhausted trends start reaching above highs or below lows only to reject immediately.
These sweeps show that the market is clearing liquidity without gaining follow-through, often trapping late entries and signaling that larger players are offloading positions.
A third indication appears when structure begins to fracture. An uptrend losing its higher-low sequence or a downtrend failing to maintain lower highs is a shift in narrative. A single break is not confirmation, but when it aligns with slowing impulses and liquidity failures, momentum is clearly changing.
Volatility then begins to compress. Candle ranges shrink, movement becomes less directional, and price enters a tightening pattern.
This compression often precedes expansion in the opposite direction. When a decisive candle breaks out of this cluster, the reversal typically accelerates.
Trend exhaustion is about recognizing when the conditions that supported continuation no longer exist.
By reading momentum, liquidity, and structure together, you can anticipate shifts earlier, manage risk more effectively, and position yourself on the right side of the next move.
BitcoinHello friends,
this is only a daily-timeframe analysis that has been decided based on reviewing the 4-hour timeframe. Please pay attention. Bitcoin has formed two major blocks in its downtrend, and there is a possibility of returning to those blocks. However, the major correction has been definitively confirmed, and I am only looking for a suitable short-position opportunity so that I can enter another unique long position in the future. In my daily analysis, there are two suitable blocks for selling; clear signs of a decline must be observed, after which you should enter the position. The analysis is very clear and does not require further explanation.
Thank you for your support, dear friends!
Wishing you all the success!
Fereydoon Bahrami
A retail trader in the Wall Street trading Center (Forex)
Risk Disclosure:
Trading in the crypto market is risky due to high price changes. This analysis is just one person's opinion and shouldn't be taken as financial advice. Before investing, it's best to talk to a financial advisor and do your own research. You are responsible for any profits or losses from this analysis

BTC. End of correction long.Only if we can take the 94.6 level the true long confirmed. Otherway it flat between 85 -95 +/-

BITCOIN CAN RETURN TO 83K AFTER BREAKOUT 90k+There is a good chance that Bitcoin could return to a new target after the breakout.
There are more TA reasons that a correction could happen at Bitcoin.
