AmznMost likely they push this up to 195-200 or trend line resistance here..
Hammer candle with volume at 50sma
Looks like a cup and handle to me
Stop loss below 180
AMZN trade ideas

Why Amazon's Stock Surge is Just the BeginningAmazon has delivered an impressive performance this year, with its stock appreciating over 20%. Many analysts believe this is just the beginning of a much larger upward trend.
Amazon's business model is undergoing a significant transformation, presenting a unique opportunity for investors. Here are three key insights that make a compelling case for buying Amazon stock now.
Resurgence in Amazon Web Services' Growth
Amazon Web Services (AWS), the company's cloud computing division, is experiencing a strong resurgence. AWS allows clients to rent computing space and run workloads over the cloud, a popular strategy that enables customers to scale computing power as needed. This is particularly relevant as many companies are developing AI models to enhance their operations.
Despite sluggish demand for AWS in 2023 compared to competitors like Google Cloud and Microsoft Azure, the outlook is improving. Amazon's significant investment in Anthropic, a generative AI startup, has equipped AWS with advanced AI tools. CEO Andy Jassy highlighted this in Amazon's Q1 conference call, stating, "We see considerable momentum on the AI front where we've accumulated a multibillion-dollar revenue run rate already."
This positive development is reflected in the financial results. In Q1, AWS saw a 17% year-over-year increase in net sales and an 84% rise in operating income. Another growth catalyst is the end of the optimization trend. Last year, companies focused on cost-cutting, including optimizing cloud computing spending. With this trend now complete, AWS is benefiting from new workloads, rather than declining revenue from reduced workloads.
AWS remains Amazon's most profitable segment, which is crucial for its success. However, other areas of the business are also starting to contribute significantly.
Amazon's Accelerating Cash Generation
While AWS has long been profitable, Amazon's commerce divisions haven't always shared that success. The company had to recover from significant investments in its supply network in 2021 and 2022, which affected its North American division. Additionally, Amazon's international operations have historically been unprofitable, but this is starting to change. In Q1, the international segment posted its first profitable quarter since 2021.
This turnaround has significantly bolstered Amazon's cash generation, which is now gaining momentum.
In the past 12 months, Amazon has generated $50.1 billion in free cash flow (FCF), a stark contrast to the $3.3 billion FCF outflow in Q1 of the previous year. The trends associated with this FCF are equally encouraging.
Historically, the first quarter is weak for Amazon due to high spending in Q4. This pattern results in a relative peak at the start of each new year, followed by a significant decline. This occurred again in 2024, but notably, this was the first year in recent memory that the drawdown did not result in a negative FCF. Additionally, the Q4 peak was the highest it has ever been.
This indicates that Amazon's cash flows are improving and sustainable, which is a positive sign for investors. As Amazon's cash flows increase, the company could initiate a dividend or start repurchasing stock, benefiting long-term investors.
Amazon is Still Below Its Average Valuation
Despite Amazon's significant cash flow growth and improvements across its business, the stock is still undervalued based on its price-to-sales (P/S) ratio. Traditional valuation metrics centered around earnings aren't as useful for Amazon yet, but the P/S ratio indicates that Amazon is valued at levels seen during the post-COVID demand drawdown and before that in 2018.
This suggests that the stock isn't overvalued and could be a reasonable purchase today.
Considering Amazon's growth prospects and increasing FCF, Amazon is an excellent buy right now. There are still many aspects of Amazon's business poised for transformation, and investors will benefit from buying and holding it for the long term.
Previous Idea

Amazon bouncing on 50EMA with 4h RSI divergence and OBV signal. - OBV signal daily
- Bouncing on the 50 EMA
- 4 hour RSI divergence.
Taking a shot here and loading more.

Amazon UpdateFor three weeks now price has been slowly grinding lower in nothing but chop. Is this the initial mini-A-wave of c? That is what it looks like to me as of now. As I have said time and time again, price can take whatever path it wants but ultimately my target boxes almost always get hit. Right now, my target box says price will eventually make it down to the $150's-$160's. I can't say for sure what path it will take or how long it will be, but I can say with confidence this appears to be a corrective pattern and one I am labeling the mini-A wave of micro c. This micro-c should complete the intermediate (A) wave of the larger wave ((2)).
Don't forget corrective patterns can chop until the cows come home and thus can take a very long time. Time wise this mini-A wave, if that is in fact what it is, has already taken longer than the initial a wave. This is partly what makes me think the mini-B wave should be starting very soon if not already. I expect that to raise to the area of the 0.236 @ $185.81 before falling again in C of c of (A) of ((2)). Plan on this larger pattern taking MONTHS to complete.

What is happening for AmazonHello everyone
I guess AMZN is so similar to another enormous teammates in Nasdaq markets and so it is a correction and then follow the rally.
I know that all of my predictions can be failed but it is not meaning that my work is wrong. You should consider a countertrend strategy for your analysis but as I always say" a tradre should chose his side (bull or bear) and decide about that and just time can disclose what is right and what is wrong.
It is not clear that this channel will be broken out to the lower levels or correction will finish in it and Rally continues. Whatever happens, we wait for the end of correction.
Be safe and happy

AMZN potential "Falling Wedge"Amazon seems to be forming a potential falling wedge pattern while also signaling bullish divergence. I believe we could see a breakout soon in Amazon....Let's see how this plays out!

SMART MONEY NEVER LIESsimplicity of bullish stocks is that when a low if formed don't go against it. Instead let it work in your favor. more is made that way, that is one of the ways the rich get richer

Amazon _ Inc _ Under _ NasdaqAmazon _ Inc _ Under _ Nasdaq
Next support : $193.31, $194.02
There is lower missing data during Jan, 2024 = from $193.1 , $194.02 it will drop to the level of $160.97 before the below prices.
Unless we get 2 support confirmation and 1 mid retest the likely of drop is high at this moment time.
______________________________
Once the Retest is confirmed we will be expecting the following prices:
$201.98
$204.30
$211.24
$214.26
$215.65
$223.19
$226.35

AMZN Watch out from this resistance level!Amzn is printing a double top formation.
it is possible for it to fail although:
1. Spx is also forming a double top formation and a correction can be anticipated
2. nvidia has to have a price correction that would drag the market with it
3.msft is also following the trendy chart pattern
This next week is critical for all these stocks, wheather they can fight the resistance up top.
gl to all traders
"the twin killers of succes are impatiance and greed" - jim ron

next few days are critical4 hourly chart moving avgs might show a printing of double top backed up by touching the 200 ema of 4hours
in that case it would be a pretty bearish scenerio.
i'd rather to avoid trying to predict if its going to play out as long as we are well above the 200 ema of the daily chart.
for now, theres surely a good squeezing of shorts and longs: theres a good support as the graph says but there's also this resistance that have been tested twice (to the double top formation)
166 was the last higher low in the daily, and it met with high demand.
as long as we dont break below these critical trend levels (deep and keep it deep) i am still bullish on amazon.
if we go under without a good bounce it will be a good sign of a trend reversal.
hard to say, no one knows the market but never fight the trend (hence daily chart is the king)

Cup with handlethe graph is acting through like cup with handle formation. I predict if graphs finish the handle, we must see serious attack from amazon. lets see how it is being end.

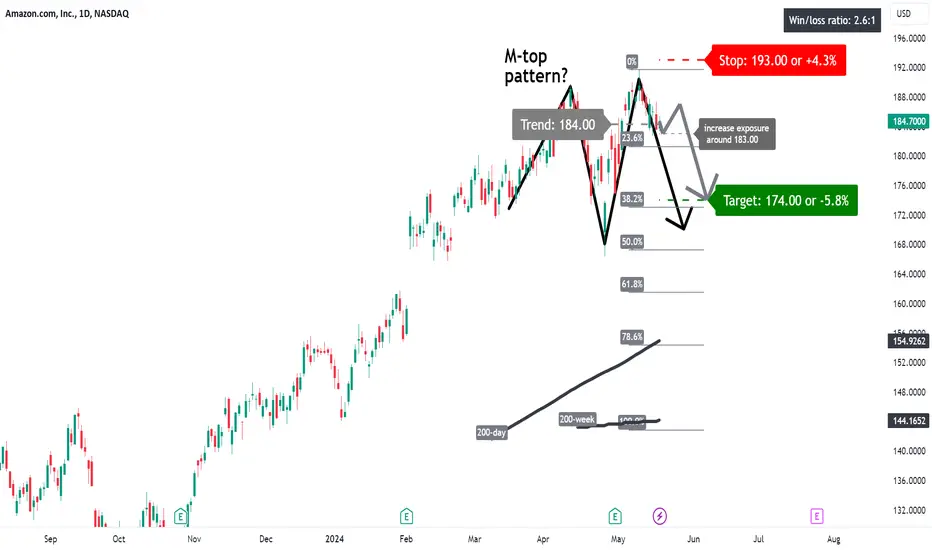
AMZN: M-top pattern?A price action below 184.00 supports a bearish trend direction.
Increase short exposure for a break below 183.00.
The target price is set at 174.00 (its 38.2% Fibonacci retracement level).
The stop-loss price is set at 193.00 (the start of the retracement).
It will appear that an M-top pattern is busy developing.
Remains a risky trade.
AMZNPair : AMAZON
Description :
Completed " 12345 " Impulsive Waves
Break of Structure
RSI - Divergence
Double Top in Short Time Frame
Fibonacci Level - 261.8%

AMZN heads up at $187.49: last strong resistance before 200This is a follow up to my $177 breakout call (click).
Nearing a significant resistance around $188.
Expecting a pullback but the market is strong.
At the least we should get some sideways action.
$ 187.49 - 188.98 is the immediate resistance of interest.
$ 197.94 - 199.63 is next major resistance and maybe top.
$ 181.95 - 182.39 is first good support that bulls must hold.
=====================================================
.

AMZN Bull FlagAMZN has been in a strong up trend since bottoming with everything else in April. It did retest it's ascending channel and failed which isn't great, but now we have a nice bull flag after several weeks of consolidation.

AMAZON | AMZN , Jeff is back? While Jeff Bezos, fiancée Lauren Sánchez have star studded engagement party on his $500M yacht Amazon has just reported its Q2 2023 earnings result, EPS of 65 cents is not comparable on YoY basis nor to consensus due to the company booking some gains related to its Rivian Automotive, Inc (RIVN) investment. Revenue of $134.3 billion beat consensus by about 2% while showing a YoY jump by nearly 11%. As an immediate reaction, the stock is up nearly 8% after-hours, although this can turn on a dime.I wrote in my preview that Amazon still remains a revenue story and to pay attention to Q2's actual revenue and Q3's revenue guidance. Amazon hit it out of the park on both counts, with Q2 revenue showing an 11% jump and Q3 guidance of $138 billion to $143 billion, easily upping the consensus of $138.29 billion.
As a direct effect of the company reining in on its expenses, Amazon's Free Cash Flow ("FCF") in Q2 2023 improved to almost $8 billon compared to -$23.5 billion in Q2 2022. Headcount is now down 4% YoY.Advertising, which I've highlighted as the next growth driver in many of my past articles, was up 22% YoY. But, more importantly, resumed its upward trajectory on a quarterly basis. Advertising services revenue showed continuous QoQ improvement until the first blip in Q1 2023. Whether Q2's upsurge is a new trend remains to be seen, but it is encouraging that Q2 did not follow Q1 down. I am also glad that my prediction that advertising will cross $10 billion in sales came true.It appears like retail has finally stopped bleeding profusely to avoid wasting all the gains from AWS and Advertising. In my view, retail is just their medium to sell their ecosystem, and this is acceptable to me.
Heading into earnings, Amazon stock was almost into the oversold territory with a Relative Strength Index ("RSI") of 37. Revenue beat and guidance should help the stock garner more analyst support in the upcoming days, and I fully expect the stock's almost-oversold conditions to be in the stock's favor as it has plenty of room upwards technically. The after-hours move has also helped the stock clear all of the commonly used moving averages.AWS's revenue and operating income appeared to be on a perennial, mid-double-digit growth trajectory until recently. However, Q2 saw AWS' sales increase by "just" 12% while operating income fell by more than 5%. It is in this context that advertising services becomes even more important. While $22 billion is strong, it fell well short of the $25 billion I predicted, as the company aims to cross $100 billion in 2023 AWS revenue.
The stock was already up 50% YTD heading into earnings and the run appears set to continue. I am not complaining as a long, but it shouldn't surprise anyone to see the stock pullback from the highs given the market's shaky behavior the last few days.
Overall, Q2 results are much better than Q1, and that shows in the stock's performance, at least as shown in the after-hours price movement. However, Amazon has never been a single quarter or single year story for me. Amazon's ecosystem is enough reason for me to continue believing in the company long-term. The ability to leverage multiple products and services across the entire organization is not something any company can build overnight. In fact, even Amazon has taken nearly 30 years to be the company that it is today

Amazon JungleWas waiting to see if the blue curve holds in this project in order to decide to post these simulated projections that take into account potential pivot points, reversals, or zones for support/resistance and BREAKOUTS... in either direction, even though I am slightly bullish biased on this one.
I have this scenario in mind where this could find support somewhere at the white or continuing on the blue or towards the red for a more decisive push in case the Earnings don't upset the whole harmony in this picture.
If everything goes to pieces will be having an eye for the possibility of the blue curve becoming resistance with a retest.
Other lower probability scenarios are some impact zones around the green and purple rectangles. If the prices reaches the top curves it would be only as a reference to see the price action around them for potential validation of the simulation.


AMZN - Day trading, Head & Shoulder pattern, bearing formationAMZN - Day trading, Head & Shoulder pattern, bearing formation for target 183

Amazon boosts investment in Singapore's cloud infrastructureAmazon Web Services (AWS) has announced a robust investment plan, committing 12bn SGD (approximately 8.88bn USD) over the next four years to bolster the cloud infrastructure in Singapore. This initiative marks a significant move by Amazon to solidify its presence in Southeast Asia, a region renowned for its rapidly expanding economies and tech-savvy population of 670 million. This investment underscores the strategic importance of Southeast Asia as a pivotal battleground for tech giants vying for market dominance.
The region's allure for tech corporations extends beyond its large population. It features dynamic economic growth and a business-friendly climate. Analysts anticipate fierce competition among providers of artificial intelligence services, with success likely to hinge on innovation, pricing strategies, and adherence to local regulations.
Analysing the investment implications, let's review the technical analysis for Amazon.com Inc. (NASDAQ: AMZN):
In the Daily (D1) timeframe, the stock has identified resistance at 189.95 USD and support at 176.55 USD. Following a recent correction, the stock has resumed its upward trajectory, indicating potential for reaching new historical highs. Should this trend reverse, the stock could retreat to a lower target of 165.00 USD.
For traders, a continuation of the uptrend with a breakthrough above the resistance level at 189.95 USD offers a potential buying opportunity, with a short-term price target of 200.00 USD. From a medium-term perspective, the price could ascend to 215.00 USD if the upward momentum is sustained.
—
Ideas and other content presented on this page should not be considered as guidance for trading or an investment advice. RoboMarkets bears no responsibility for trading results based on trading opinions described in these analytical reviews.
The material presented and the information contained herein is for information purposes only and in no way should be considered as the provision of investment advice for the purposes of Investment Firms Law L. 87(I)/2017 of the Republic of Cyprus or any other form of personal advice or recommendation, which relates to certain types of transactions with certain types of financial instruments.
Risk Warning: CFDs are complex instruments and come with a high risk of losing money rapidly due to leverage. 69.88% of retail investor accounts lose money when trading CFDs with this provider. You should consider whether you understand how CFDs work and whether you can afford to take the high risk of losing your money.

AMZN Short: Potential Ending Diagonal on Price-Volume DivergenceThis is a short call that I had forced the last wave up to be an "ending diagonal". The reason for doing so is because of the price-volume divergence that is shown on the daily timeframe when AMZN was making a new high.
For those who are familiar with "Ending Diagonal", the imperfection will to be pointed out is"
"Wave 1" did not show clear 3 waves.
"Wave 2" is irregular.
As I admitted on the first paragraph, I did FORCE this count to show a possibility. Thus the stop loss is very tight: just above the high. The first take profit target will be where the wave 4 of a higher degree ends.


