🟢 MSFT - 3D (07.10.2022)🟢 MSFT
TF: 3D
Side: Long
SL: $232.73
TP 1: $260.33
TP 2: $277.40
TP 3: $291.20
Spotted some bullish divergence on the Microsoft 3D chart.
I am expecting a relief bounce here that could last several weeks.
1W RSI and MACD also look ready to support the movement.
MSFT trade ideas

MSFT daily frame (lead diagonal, prim [B] target 285; 3/31/23)this count gives clues that leading diagonal in primary & a counter trend in a form of single zig zag ending in the latter part of March 23' around 285

MSFT daily frame (minor 2 target 268)this count gives minor 2 in progress around the end of october 22'
expect the a powerful 3 of 3 within the wave structure.

Microsoft (MSFT) bullish scenario:The technical figure Flag can be found in the daily chart in the US company Microsoft Corporation (MSFT). Microsoft Corporation is an American multinational technology corporation which produces computer software, consumer electronics, personal computers, and related services. Its best-known software products are the Windows line of operating systems, the Microsoft Office suite, and the Internet Explorer and Edge web browsers. Its flagship hardware products are the Xbox video game consoles and the Microsoft Surface lineup of touchscreen personal computers. The Flag broke through the resistance line on 05/10/2022. If the price holds above this level, you can have a possible bullish price movement with a forecast for the next 9 days towards 260.20 USD. Your stop-loss order, according to experts, should be placed at 235.20 USD if you decide to enter this position.
Investors will be hoping for strength from Microsoft as it approaches its next earnings release. In that report, analysts expect Microsoft to post earnings of $2.31 per share. This would mark year-over-year growth of 1.76%.
In terms of valuation, Microsoft is currently trading at a Forward P/E ratio of 24.74. For comparison, its industry has an average Forward P/E of 23.21, which means Microsoft is trading at a premium to the group.
Meanwhile, MSFT's PEG ratio is currently 2.11. This popular metric is similar to the widely-known P/E ratio, with the difference being that the PEG ratio also takes into account the company's expected earnings growth rate. The Computer - Software was holding an average PEG ratio of 2.04 at yesterday's closing price.
Risk Disclosure: Trading Foreign Exchange (Forex) and Contracts of Difference (CFD's) carries a high level of risk. By registering and signing up, any client affirms their understanding of their own personal accountability for all transactions performed within their account and recognizes the risks associated with trading on such markets and on such sites. Furthermore, one understands that the company carries zero influence over transactions, markets, and trading signals, therefore, cannot be held liable nor guarantee any profits or losses.

Falling Wedge//1.414Price is at the 50% mark of the trend up and appears a falling wedge has formed. The trendlines are narrowing.
A falling wedge can be bullish , especially in a Bull Market.
Who knows if this will make a run to the upside once more.
I just would not short this stock right now.
Doji at support at this moment.
Pocket pivot at the 50% retracement.
Targets down for the W structure have been met. Price is sitting on T3. This is another W that terminated at the 1.414
There are still unbroken rising wedges under price that are not valid yet as the bottom trendline is not broken.
That does not count out a pop to the upside, even if just temporary.
No recommendation.

Double top set up for morning sell off?All the other top weighted spy stocks ended in overbought or near overbought RSI levels after the steep bull rally today.
Msft looks like its set up a double top and is ready to go down hard tomorrow morning.

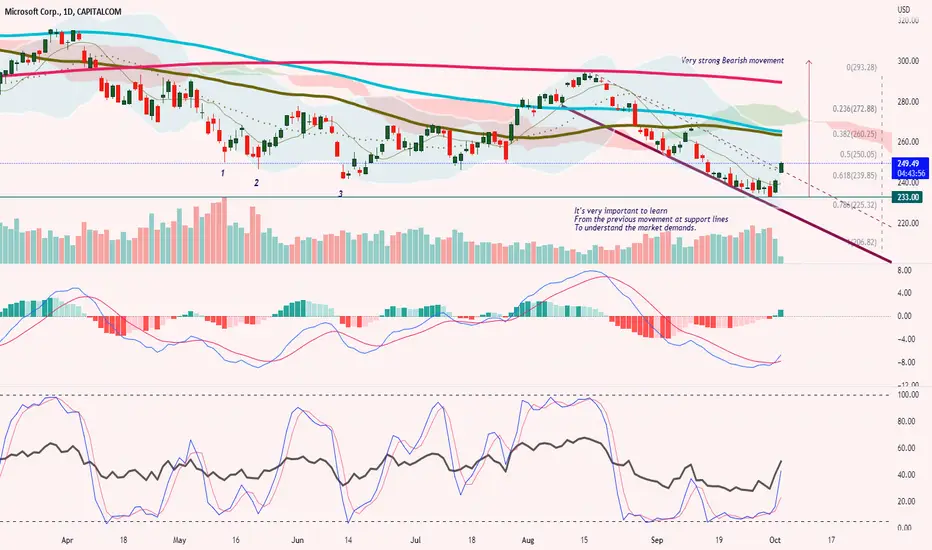
MSFT Overall Trend and Elliott Wave Analysis Between 8/3/22 and 8/4/22, MSFT broke and held above it’s daily, weekly, and monthly pivot points after breaking out out of a falling wedge that bounced off of a major demand zone between the prices of $235.04 and $242.38 that was formed back on 5/12/21 - 6/3/21.
Currently I am watching MSFT for a reject at the resistance zone between $151-$153 (Note that this resistance zone is located between the 50% and 61.8% fibonacci level marked from the high of $267.58 and the low of $232.77), followed by a GAP fill below at $241-$245 to form a higher low before heading higher to retest the resistance zone. (Hopefully breaking through to fill the next GAP up between $260-$265. This GAP is also located at the 50% fibonacci level marked from the high of $293.56 and the low of $232.77.)
This next move up from the falling wedge marks the end of wave 1 of overall correction wave C and the beginning of wave 2 of overall correction wave C. After filling the middle GAP between $260-$265, I am anticipating for MSFT to reject from an overall downtrend line (Dotted white lines), to complete wave 2 and make its way back to the downside to begin the completion of wave 3 or overall correction wave C.
The above analysis is for reference purposes. Plan day trades or swing trades according to levels, trends, and waves.
SN: Check MACD, Stochastic, and RSI indicators for added confirmation on these moves.

MSFT: A bullish reaction in a support area!• MSFT is reacting just above a clear support level at $235.10 (dividend adjusted chart);
• Although we see a strong bullish reaction, we don’t see reversal signs yet;
• Would be good if MSFT close the weekly chart like this, or if we see a clear bullish reversal pattern in the daily chart before assuming it’ll reverse;
• Either way, there are two open gaps (yellow squares, daily chart), and they would be our next targets if MSFT confirms a reversal;
• On the other hand, by losing the $235 level, it will just resume the bear trend and seek the $200 area;
• This could be the beginning of a strong reversal, so it is important to keep an eye on MSFT for now, as the Risk/Reward ratio looks very good.
I’ll keep you guys updated on this. Remember to follow me for more analysis like this! Keep in touch.

MICROSOFTTuesday, 4 October 2022
22:15 PM (WIB)
Facts About Microsoft
Microsoft enables digital transformation in the era of an intelligent cloud and an intelligent edge.
Its mission is to empower every person and every organization on the planet to achieve more.
For more details about Microsoft, please come visit the website .
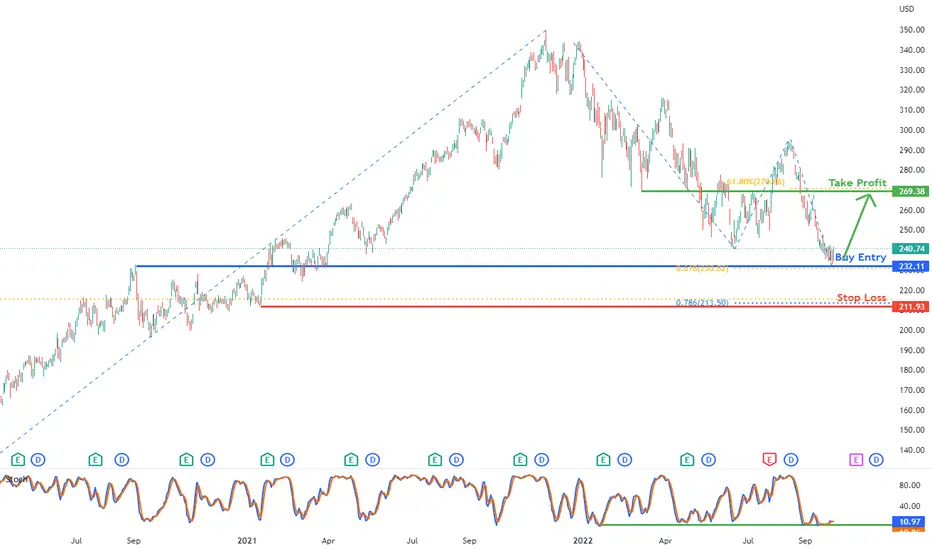
MSFT Potential for Bullish Continuation | 4th Oct 2022On H4, with the RSI bouncing from the support level, and the price is reaching the key support level, we have a bullish bias that the price may rise from the buy entry at 232.11, where the overlap support and 61.8% fibonacci projection are to the take profit at 239.38, where the 61.8% fibonacci retracement is. Alternatively, the price may drop to the stop loss at 211.98, where the 61.8% fibonacci retracement and 78.6% fibonacci projection are.
Any opinions, news, research, analyses, prices, other information, or links to third-party sites contained on this website are provided on an "as-is" basis, as general market commentary, and do not constitute investment advice. The market commentary has not been prepared in accordance with legal requirements designed to promote the independence of investment research, and it is therefore not subject to any prohibition on dealing ahead of dissemination. Although this commentary is not produced by an independent source, FXCM takes all sufficient steps to eliminate or prevent any conflicts of interest arising out of the production and dissemination of this communication. The employees of FXCM commit to acting in the clients' best interests and represent their views without misleading, deceiving, or otherwise impairing the clients' ability to make informed investment decisions. For more information about the FXCM's internal organizational and administrative arrangements for the prevention of conflicts, please refer to the Firms' Managing Conflicts Policy. Please ensure that you read and understand our Full Disclaimer and Liability provision concerning the foregoing Information, which can be accessed on the website.
Analysis on Microsoft - long set up Buy above 242 with the mentioned SL in the chart. Targets for the long set up are given clearly. Thanks

MSFT Long?May bounce /correction/ will come. It looks like another correction is near for MSFT. It looks that a sharp sell of eases and price is coming to Mar-21 consolidation price. I think now, before the earnings report little or medium correction will come to MSFT.

msft 2 scenariosmsft 2 scenarios .. 1] buy after the break above the support 1 and 50ma .. 2] sell under the support 1 and follow the channel ...

MSFT OCT gainsWatching how the market reacted in Sept says a lot. I think that 225-230 is going to be support for the near term. I think the market as a whole will rally due to the oversold positions throughout the market as well as other indicators. I think MSFT has a really good shot of testing 270 levels. will the possibility of going to 290. I am long term bearish, I just think there has been to much down turn in the market.

Longing Microsoft. MSFTIn conjunction with the uptrend on the major indices (locally), we are seeing a recovery in this major stock. It remains to be seen what exactly we are to paint out - a zigzag, triangle and its many varieties. Momentum is upgoing on SPX, which gives us confidence to see more growth in the tech sector.
We are not in the business of getting every prediction right, no one ever does and that is not the aim of the game. The Fibonacci targets are highlighted in purple with invalidation in red. Confirmation level, where relevant, is a pink dotted, finite line. Fibonacci goals, it is prudent to suggest, are nothing more than mere fractally evident and therefore statistically likely levels that the market will go to. Having said that, the market will always do what it wants and always has a mind of its own. Therefore, none of this is financial advice, so do your own research and rely only on your own analysis. Trading is a true one man sport. Good luck out there and stay safe.

MSFT AnalysisPrice did not play out as expected. I was expecting price to head up towards the bearish POI at 251.94 before going lower. Right now, it seems that there is insufficient liquidity to push the price higher even after grabbing the lows at 238.07. Price is likely to head lower towards the bullish POI at 220.58.


MSFT Microsoft Corporation Technical ReboundIf you haven`t sold MSFT after they Issued the Warning to Investors:
Then you should know that the chart reached our price target perfectly and is now ready for a technical rebound.
A technical rebound refers to a recovery from a prior period of losses when technical signals indicate that the move was oversold.
In this case, the Relative Strength Index momentum indicator of MSFT Microsoft Corporation is at 24.30.
Even though i am overall bearish on the economy, buying a strong financial instrument when the RSI is below 30, would make a case for a potential short term reversal.
Looking forward to read your opinion about it.

Microsoft's local reboundMicrosoft Corporation
Ticker: MSFT
Idea: Long
Horizon: 1-2 months
Target 1: $264
Target 2: $281
Stop order: $233
Entry range: 238-241 USD
Technical analysis
The price is in the support zone around $241, where a local bounce up can be formed.
Fundamental factor
Microsoft is one of the largest multinational companies producing proprietary software for various kinds of computing equipment: personal computers, game consoles, PDAs, cell phones and others. On Sept. 20, company representatives announced that Microsoft is releasing special features updates for Windows 11. In addition, Microsoft said it would raise its quarterly dividend by 10% (to $0.68 per share). All of this is a positive backdrop for the company.

Microsoft Stock Analysis. Biggest sell-off in history happeningMicrosoft Stock Analysis. The biggest sell-off in history has been happening since the end of 2021. Long-term shorts are playing out on Microsoft stock.
New supply levels are being created on the weekly timeframe; the last one is located at $256 per share. Microsoft's stock price today is still bearish. The stock might take some time to pull back to the supply imbalance shown in the Microsoft stock video analysis and prediction.
The expectations for the IT giant are very negative, regardless of any positive news, earnings, or new products and acquisitions. MSFT stock price could drop as far down as $65 in the following months. You can use bearish stock option strategies to take advantage of the sell-off in Microsoft stock.

MSFT - Stair-Stepping DownMSFT appears to be reversing years of advance. Stair-Stepping Down. Watch key support.


MSFT stock idea trade setup - 9/26/2022The next level of support is at 233 levels, I would go long at 233, with a stop at 230 level and target at 241 levels.
Based on how this stock is falling, I feel this should happen around its earnings timeframe.
P.S. The only worry is that quite a bit of revenue for Microsoft is generated from rest of the world. With this strengthening of dollar, the revenue is getting crushed. Eg. A year ago, 1 USD = 1050 KRW. Now it is 1 USD = 1450 KRW(south korean won). So, if microsoft was selling office for 100000 KRW(approximately 100 USD) a year ago, now microsoft is making only 72 USD.
Though the stock does well, because of the FX rates things are not looking good.
