MSFT trade ideas

MSFT D1: buy by market SL 341 TP1 305The stocks reached bullish turning point of fixed cycles composite line (write a private message for details explanations). As 241 local low wasn't renewed this means that the stocks are going to turn into a long-run increase.

MSFT longmest capital indicator has generated an alert of going long in equity for MICROSOFT CORP
Timeframe: weekly
Entry : High price of candel
Stoploss: Low price of candel
Happy trading 🙏

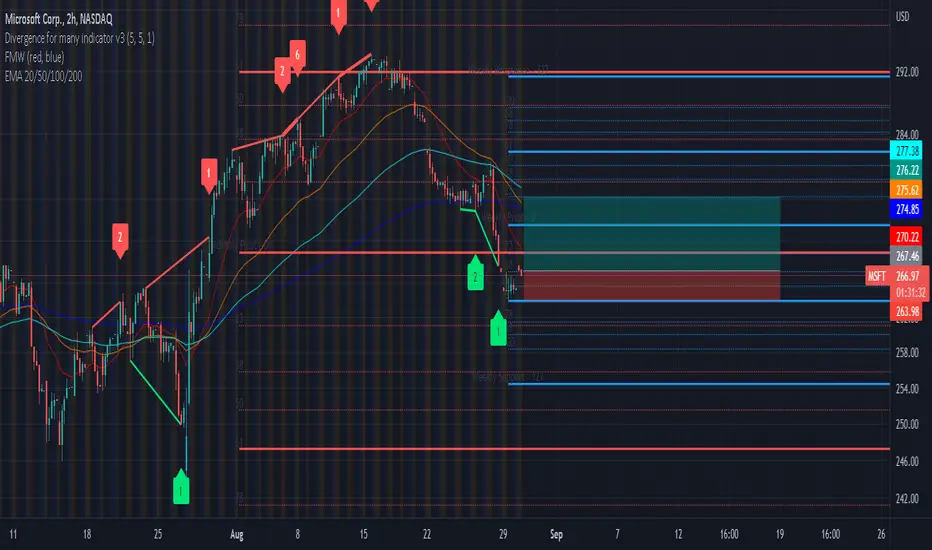
MSFT - Short position When looking at MSFT current underlying value and most recent price behaviour when using a 2-hour range, investors can see that on the 02/09/22 a three-bar pattern formed making up a shooting star. In this instance, this was a bareish indication, a failed attempt to correct the underlying stock value´s bearish momentum with bullish momentum.
When observing 50 and 100 day ranged EMA averages investors can see that on the 26/08/22 shorter 50-day EMA moving average crossed beneath the longer 100-day EMA moving average. This dead cross was followed by a strong down trend, underlying prices falling 7%. This was after bullish rallies that were witnessed since mid-July. On 27/07/22 shorter 50-day EMA moving average crossed above longer 100-day EMA moving average. This fresh bullish crossover was followed by a rally that saw the underlying share value continue to increase over 10%. Currently EMA moving average lines are not moving back towards one another, instead they are moving parallel in a different trajectory. Therefore, the down trend is more likely to strengthen before corrections occur.
When observing MACD and signal lines, investors can see that 06/09/22 the MACD line crossed beneath the signal line. This further supports our bearish sentiment.
Based on EMA moving averages, candlestick patterns and behaviour as well as MACD and signal lines, we are bareish in sentiment. We anticipate that the stock will fall further and have taken a short position as a result.

MSFTShortest short short short
230 and 215 support lvls are to watch. Tech breaking down with yields shooting up. SPY currently at bounce zone though so i'm currently indecisive, lets see what Powell has in store for us..

MSFT - Mean reversion rebound ahead?Microsoft 2nd half of the trading session saw some halting of the bearish move at the support zone between 250-252. As such, we believe that there would be a short-term rebound moving on.

MSFT Potential for Bearish Continuation| 6th September 2022On H4, with the price crossing the ichimoku cloud , within the descending channel and DIF line is below zero axis, we have a bearish bias that the price may drop from the sell entry at 251.96, which is in line with the 78.6% fibonacci retracement to the take profit at 240.90, where the swing low is. Alternatively, the price may rise to the stop loss at 265.50, which is in line with the 23.6% fibonacci retracement .
Any opinions, news, research, analyses, prices, other information, or links to third-party sites contained on this website are provided on an "as-is" basis, as general market commentary, and do not constitute investment advice. The market commentary has not been prepared in accordance with legal requirements designed to promote the independence of investment research, and it is therefore not subject to any prohibition on dealing ahead of dissemination. Although this commentary is not produced by an independent source, FXCM takes all sufficient steps to eliminate or prevent any conflicts of interest arising out of the production and dissemination of this communication. The employees of FXCM commit to acting in the clients' best interests and represent their views without misleading, deceiving, or otherwise impairing the clients' ability to make informed investment decisions. For more information about the FXCM's internal organizational and administrative arrangements for the prevention of conflicts, please refer to the Firms' Managing Conflicts Policy. Please ensure that you read and understand our Full Disclaimer and Liability provision concerning the foregoing Information, which can be accessed on the website.

MSFT Potential for Bearish Continuation| 6th September 2022On H4, with the price crossing the ichimoku cloud, within the descending channel and DIF line is below zero axis, we have a bearish bias that the price may drop from the sell entry at 251.96, which is in line with the 78.6% fibonacci retracement to the take profit at 240.90, where the swing low is. Alternatively, the price may rise to the stop loss at 265.50, which is in line with the 23.6% fibonacci retracement.
Any opinions, news, research, analyses, prices, other information, or links to third-party sites contained on this website are provided on an "as-is" basis, as general market commentary, and do not constitute investment advice. The market commentary has not been prepared in accordance with legal requirements designed to promote the independence of investment research, and it is therefore not subject to any prohibition on dealing ahead of dissemination. Although this commentary is not produced by an independent source, FXCM takes all sufficient steps to eliminate or prevent any conflicts of interest arising out of the production and dissemination of this communication. The employees of FXCM commit to acting in the clients' best interests and represent their views without misleading, deceiving, or otherwise impairing the clients' ability to make informed investment decisions. For more information about the FXCM's internal organizational and administrative arrangements for the prevention of conflicts, please refer to the Firms' Managing Conflicts Policy. Please ensure that you read and understand our Full Disclaimer and Liability provision concerning the foregoing Information, which can be accessed on the website.

MSFT AnalysisPrice played out exactly as analyzed last week. Price is currently mitigating the bullish POI at 260.84. I expecting the price to rally from here up into the bearish POI at 274.52.

MSFT might see macro trend failure pattern. We're into a point where MSFT is testing the supports of a butterfly pattern. While this is in itself a bullish pattern, those who have experience trading harmonics will know that the failure of harmonics often produces a strong countermove.
Those experienced in trend reversal patterns will know that the butterfly must always form and fail if we're making an Elliot wave style reversal.
It's impossible for the butterfly to not form. Legs one and two of Elliot have to make something that's similar to waves ABC of a butterfly. It then has to make a new low in wave three which has to be consistent with the D move of a butterfly. This is an unavoidable false signal - And when this particular signal fails in this particular setup, it usually waterfalls.
I believe the bullish setup has already failed. MSFT should already be higher if a low is being made. In most instances I've seen this type of PA into these sorts of patterns a break has followed.

$MSFT - potential support in phase 4 $MSFT has been in selloff and it's been frequently discussed these days. If we break current level, there is not much demand down to $220 and $208, which would be about 36-40% down from ATH, respectively.
I can see MSFT getting there if overall market is wacky. Chaikin Oscillator with Bollinger bands also generated sell signal on August 8th and since then it's been in an ugly downtrend. This also looks like a phase 4 - downtrend.
I'll wait patiently and might start adding to my position around 220. Good old MSFT.

MSFTNot financial advice. The essence of investing & trading is the intelligent and patient preying on the greed, fear, impatience, addiction and ignorance of the majority. It's definitionally Darwinian.

MSFT strong sellEntry price: 274
Target price 1: 268.5 +2%
Target price 2: 261.8 +4.6%
Stop-loss: 280.1 -2.1%
Period length: 8 days

Lower still!Price is moving down again in a well established downtrend channel making lower lows and lower highs ! It might be on its way to the 220 area where there is a long term uptrend support along with the bottom of the down channel !
I will wait to see if you get there and IF, then I will decide what to do ! Just my opinion!

MICROSOFT CORP.Ascending to the strongest bounced peak from which descending peaks were formed to the end of the strong demand area and upon arrival wool is determined the target precisely

MSFT - Long PositionDivergence indication signals suggest bullish change in momentum.
Candlestick momentum shows a potential bullish hammer. The underlying stock price presented in the form of candlesticks seems to be reversing in line with its moderate 0.38 weekly support level. A bullish hammer can be identified within the down trend, a bullish hammer suggests that there will be a change in momentum.
When applying a weekly and monthly ranged Fibonacci, investors can see that this potential bullish hammer is occurring in line with its moderate 0.38 support level. However, when looking at the 1-month ranged Fibonacci investors are wary given that the stock is trading close to its central 0.00 pivot level.
EMA indicators suggest the stock is undervalued given that the underlying stock value is currently trading below all 20-, 50-, 100- and 200-day EMA averages. Furthermore, the crossover of 20- and 50-day EMA lines is a buy signal.
Based on these undervalued signals, we anticipate the stock to correct towards a stronger resistance.