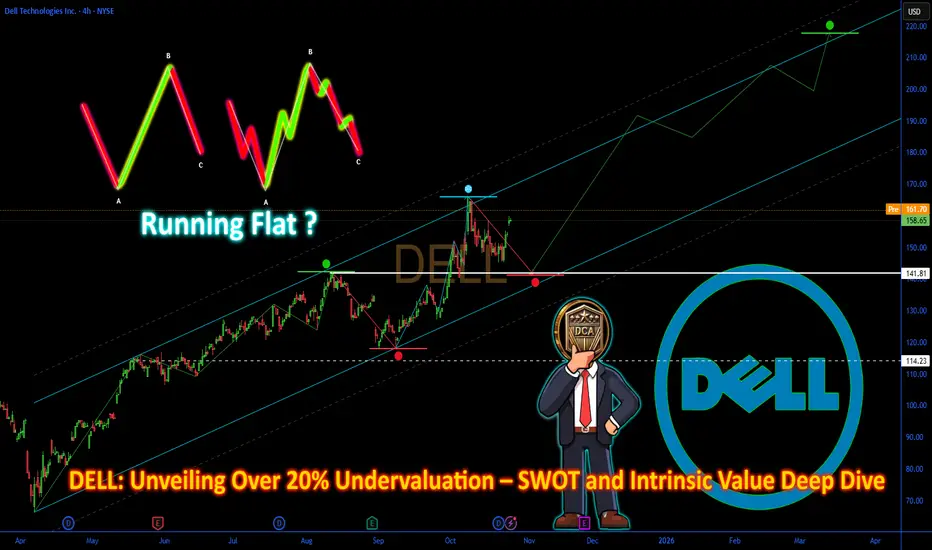
DELL: Unveiling Over 20% Undervaluation DELL: Unveiling Over 20% Undervaluation – SWOT and Intrinsic Value Deep Dive
Introduction
📊 As of October 27, 2025, Dell Technologies Inc. (DELL), a leading provider of IT hardware, software, and services with a focus on servers and storage, is capitalizing on AI-driven growth within the technology
Key facts today
Next report date
—
Report period
—
EPS estimate
—
Revenue estimate
—
5.644 CHF
4.19 B CHF
87.03 B CHF
316.43 M
About Dell Technologies Inc.
Sector
Industry
CEO
Michael Saul Dell
Website
Headquarters
Round Rock
Founded
1984
ISIN
US24703L2025
FIGI
BBG019RGVQ02
Dell Technologies, Inc. is a technology company, providing customers with a broad and innovative solution portfolio to help customers modernize their information technology (IT) infrastructure, address workforce transformation, and offer critical solutions that keep people and organizations connected. It operates through the following segments: Infrastructure Solutions Group (ISG) and Client Solutions Group (CSG). The ISG segment includes servers, networking, and storage, as well as services and third-party software and peripherals that are closely tied to the sale of ISG hardware. The CSG segment includes designs for commercial and consumer customers of desktops, thin client products, and notebooks. The company was founded by Michael Saul Dell in 1984 and is headquartered in Round Rock, TX.
Related stocks
DELL - Inverted H&S An example of an inverted H&S pattern on the daily timeframe for DELL
As we are approaching the end of the right shoulder (a bullish phase), I expect price to continue up
I expect this scenario over resistance at the green line that price is currently testing.

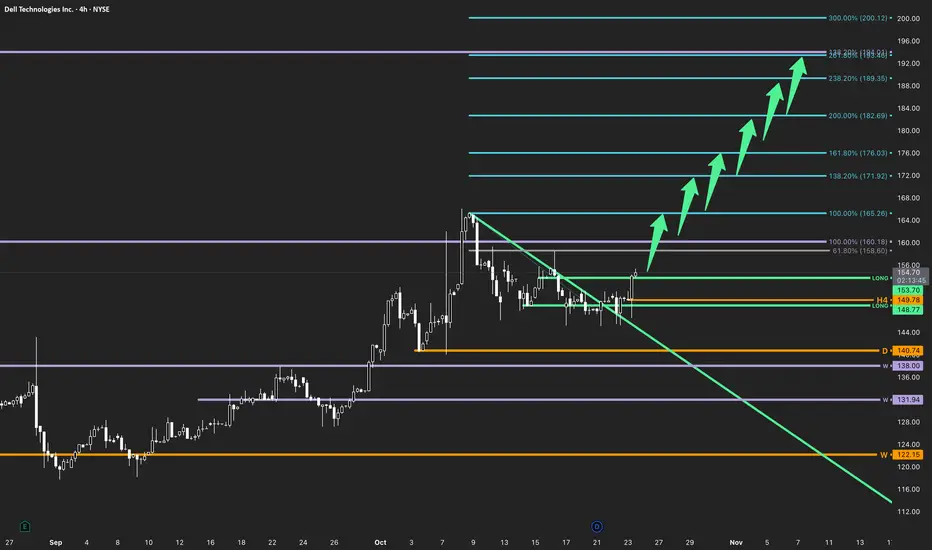
DELL | Multi-Timeframe Expansion SetupThe Market Flow | Oct 23, 2025
Technical Overview
Weekly: Structure remains bullish, with price holding above the active pivot at 138.00 . Weekly Fibonacci 138.2% extension aligns with the medium-term upside path toward 192.84 .
Daily: The daily countertrend originating from the recent wee
DELL - The Long Climb=======
Volume
=======
- slight increase
==========
Price Action
==========
- Latest downtrend line broken and supported pullback way above line
- Rounded bottom
- Change of trend observed
=========
Oscillators
=========
- Ichimoku
>>> price above cloud
>>> green kumo
>>> base + conv + lagging ab

DELL | New All Time Highs Incoming | LONGDell Technologies, Inc. is a technology company, providing customers with a broad and innovative solution portfolio to help customers modernize their information technology (IT) infrastructure, address workforce transformation, and offer critical solutions that keep people and organizations connecte

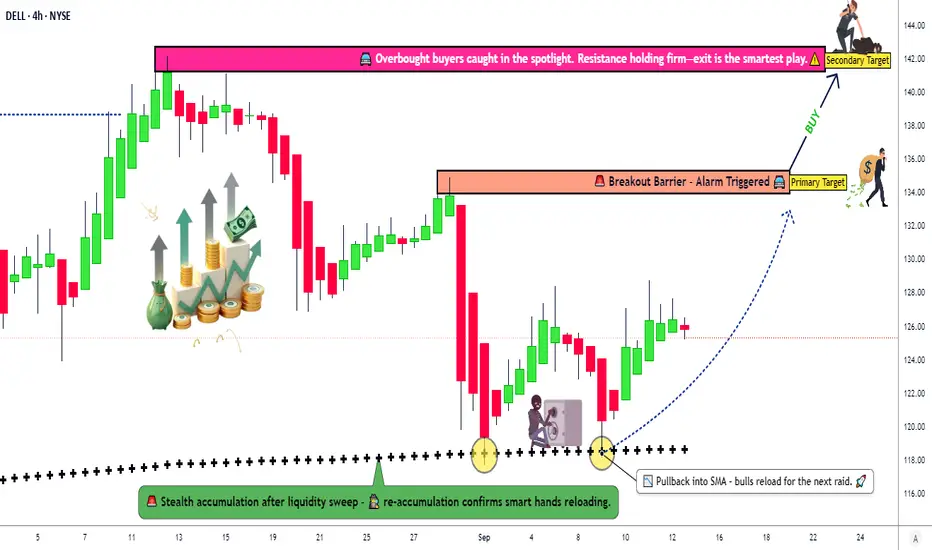
Dell Stock Idea – Bullish Outlook With Layered Entries💰 Dell Technologies INC: The Great Stock Market Heist Plan (Swing/Day Trade) 💰
🎯 Asset: Dell Technologies INC (DELL)🎭 Vibe: Bullish Bandits on the Move! The Simple Moving Average (SMA) is flashing green, confirming a buy trend, and the big institutional players are piling in. Time to join the heist
Downtrend in Dell?Dell Technologies has lagged the market for months, and some traders may see further downside in the maker of computer hardware.
The first pattern on today’s chart is the bearish gap on August 29 following quarterly results. While earnings and revenue beat estimates, investors focused on weaker mar

DELL - LONG Swing Entry PlanNYSE:DELL - LONG Swing Entry Plan
E1: $ 119.00 – $ 116.00
E2: $ 109.00 – $ 110.00
AD: $ 98.00 – $ 97.00
___________________________
TP 1 - $ 127.00 - 8%
___________________________
Entry 1
→ Open initial position targeting +8% from entry level.
Entry 2
→ If price dips further, average down with

DELL eyes on $116.10: Golden Genesis fib will determine TrendDELL has been a sleepy stock with mixed earnings.
Now testing a proven Golden Genesis at $116.01
Look for a Break-and-Retest to start an Uptrend.
.
See "Related Publications" for other plots ---------------------->>>>>>>
This one in particular is caught the BOTTOM exaclty:
====================

Dell, bullish, ascending triangleNYSE:DELL looks ready to go
4 weeks of tight price action with higher lows
AI infra has been hot and dell is a key player
nuff said

See all ideas
Summarizing what the indicators are suggesting.
Neutral
SellBuy
Strong sellStrong buy
Strong sellSellNeutralBuyStrong buy
Neutral
SellBuy
Strong sellStrong buy
Strong sellSellNeutralBuyStrong buy
Neutral
SellBuy
Strong sellStrong buy
Strong sellSellNeutralBuyStrong buy
An aggregate view of professional's ratings.
Neutral
SellBuy
Strong sellStrong buy
Strong sellSellNeutralBuyStrong buy
Neutral
SellBuy
Strong sellStrong buy
Strong sellSellNeutralBuyStrong buy
Neutral
SellBuy
Strong sellStrong buy
Strong sellSellNeutralBuyStrong buy
Displays a symbol's price movements over previous years to identify recurring trends.
DELL5208606
EMC Corporation 8.35% 15-JUL-2046Yield to maturity
5.92%
Maturity date
Jul 15, 2046
DELL5212276
EMC Corporation 8.1% 15-JUL-2036Yield to maturity
5.39%
Maturity date
Jul 15, 2036
DELL5208605
EMC Corporation 6.02% 15-JUN-2026Yield to maturity
4.96%
Maturity date
Jun 15, 2026
XS284326288
Dell Bank International DAC 3.625% 24-JUN-2029Yield to maturity
2.94%
Maturity date
Jun 24, 2029
XS254525987
Dell Bank International DAC 4.5% 18-OCT-2027Yield to maturity
2.88%
Maturity date
Oct 18, 2027
XS240044528
Dell Bank International DAC 0.5% 27-OCT-2026Yield to maturity
2.28%
Maturity date
Oct 27, 2026
See all 12DA bonds
Curated watchlists where 12DA is featured.


Frequently Asked Questions
The current price of 12DA is 122.439 CHF — it has decreased by −10.08% in the past 24 hours. Watch Dell Technologies, Inc. Class C stock price performance more closely on the chart.
Depending on the exchange, the stock ticker may vary. For instance, on BX exchange Dell Technologies, Inc. Class C stocks are traded under the ticker 12DA.
12DA stock has fallen by −4.41% compared to the previous week, the month change is a 4.80% rise, over the last year Dell Technologies, Inc. Class C has showed a 14.37% increase.
We've gathered analysts' opinions on Dell Technologies, Inc. Class C future price: according to them, 12DA price has a max estimate of 162.15 CHF and a min estimate of 105.40 CHF. Watch 12DA chart and read a more detailed Dell Technologies, Inc. Class C stock forecast: see what analysts think of Dell Technologies, Inc. Class C and suggest that you do with its stocks.
12DA reached its all-time high on May 30, 2024 with the price of 167.502 CHF, and its all-time low was 65.160 CHF and was reached on Apr 11, 2025. View more price dynamics on 12DA chart.
See other stocks reaching their highest and lowest prices.
See other stocks reaching their highest and lowest prices.
12DA stock is 11.21% volatile and has beta coefficient of 1.87. Track Dell Technologies, Inc. Class C stock price on the chart and check out the list of the most volatile stocks — is Dell Technologies, Inc. Class C there?
Today Dell Technologies, Inc. Class C has the market capitalization of 83.06 B, it has decreased by −2.89% over the last week.
Yes, you can track Dell Technologies, Inc. Class C financials in yearly and quarterly reports right on TradingView.
Dell Technologies, Inc. Class C is going to release the next earnings report on Nov 25, 2025. Keep track of upcoming events with our Earnings Calendar.
12DA earnings for the last quarter are 1.89 CHF per share, whereas the estimation was 1.87 CHF resulting in a 1.24% surprise. The estimated earnings for the next quarter are 2.00 CHF per share. See more details about Dell Technologies, Inc. Class C earnings.
Dell Technologies, Inc. Class C revenue for the last quarter amounts to 24.27 B CHF, despite the estimated figure of 23.65 B CHF. In the next quarter, revenue is expected to reach 22.02 B CHF.
12DA net income for the last quarter is 948.86 M CHF, while the quarter before that showed 798.77 M CHF of net income which accounts for 18.79% change. Track more Dell Technologies, Inc. Class C financial stats to get the full picture.
Yes, 12DA dividends are paid quarterly. The last dividend per share was 0.42 CHF. As of today, Dividend Yield (TTM)% is 1.33%. Tracking Dell Technologies, Inc. Class C dividends might help you take more informed decisions.
Dell Technologies, Inc. Class C dividend yield was 1.72% in 2024, and payout ratio reached 27.91%. The year before the numbers were 1.71% and 32.15% correspondingly. See high-dividend stocks and find more opportunities for your portfolio.
As of Nov 6, 2025, the company has 108 K employees. See our rating of the largest employees — is Dell Technologies, Inc. Class C on this list?
EBITDA measures a company's operating performance, its growth signifies an improvement in the efficiency of a company. Dell Technologies, Inc. Class C EBITDA is 8.57 B CHF, and current EBITDA margin is 10.41%. See more stats in Dell Technologies, Inc. Class C financial statements.
Like other stocks, 12DA shares are traded on stock exchanges, e.g. Nasdaq, Nyse, Euronext, and the easiest way to buy them is through an online stock broker. To do this, you need to open an account and follow a broker's procedures, then start trading. You can trade Dell Technologies, Inc. Class C stock right from TradingView charts — choose your broker and connect to your account.
Investing in stocks requires a comprehensive research: you should carefully study all the available data, e.g. company's financials, related news, and its technical analysis. So Dell Technologies, Inc. Class C technincal analysis shows the buy rating today, and its 1 week rating is buy. Since market conditions are prone to changes, it's worth looking a bit further into the future — according to the 1 month rating Dell Technologies, Inc. Class C stock shows the buy signal. See more of Dell Technologies, Inc. Class C technicals for a more comprehensive analysis.
If you're still not sure, try looking for inspiration in our curated watchlists.
If you're still not sure, try looking for inspiration in our curated watchlists.