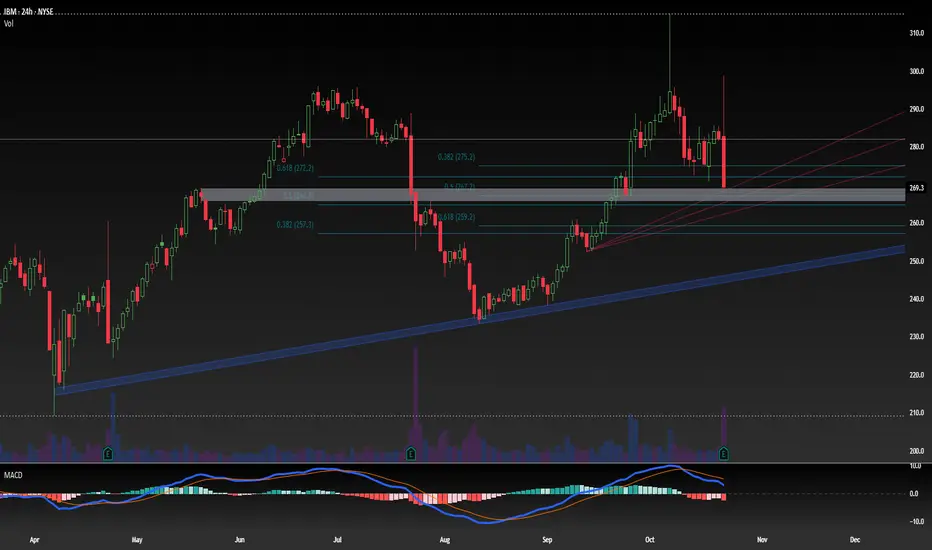
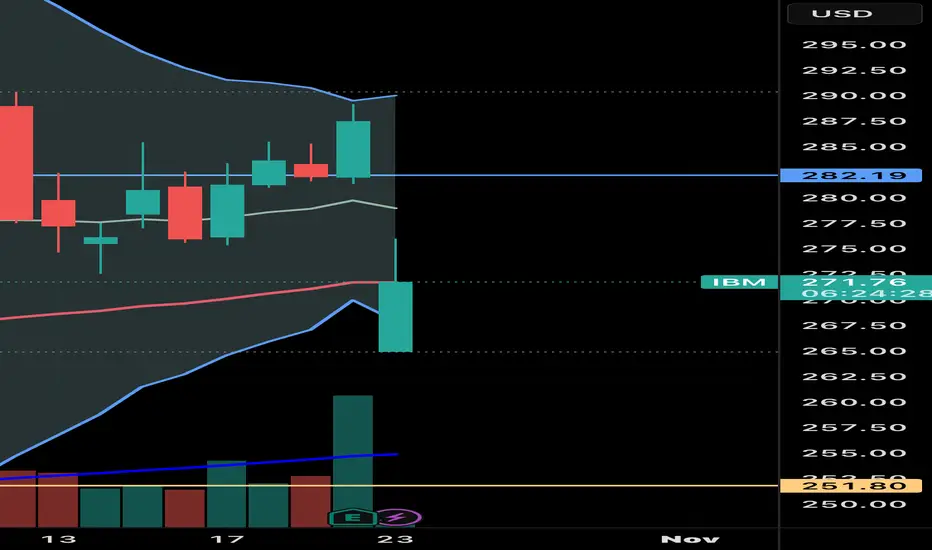
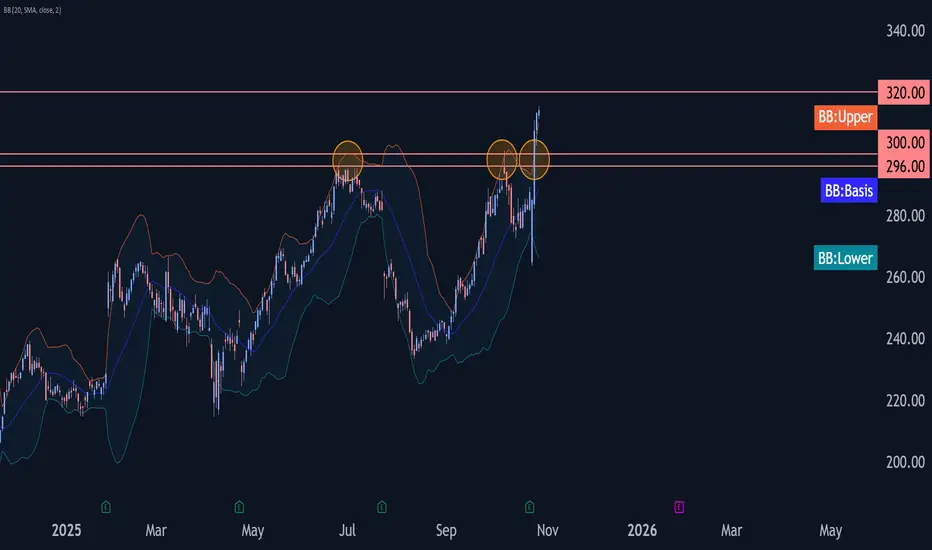
Levels to trade IBM's Wyckoff Distribution phaseWhile IBM beat EPS and revenue estimates, the stock is selling off hard. News indicates investors are focused on decelerating growth in the key Red Hat (software) segment. This "sell the news" reaction is a classic confirmation of a distribution top.
Key facts today
Next report date
—
Report period
—
EPS estimate
—
Revenue estimate
—
6.777 CHF
5.47 B CHF
56.99 B CHF
933.80 M
About International Business Machines Corporation
Sector
Industry
CEO
Arvind Krishna
Website
Headquarters
Armonk
Founded
1911
ISIN
US4592001014
FIGI
BBG006M6Y279
International Business Machines Corporation (IBM) is a technology company. The Company operates through five segments: Cognitive Solutions, Global Business Services (GBS), Technology Services & Cloud Platforms, Systems and Global Financing. The Cognitive Solutions segment delivers a spectrum of capabilities, from descriptive, predictive and prescriptive analytics to cognitive systems. Cognitive Solutions includes Watson, a cognitive computing platform that has the ability to interact in natural language, process big data, and learn from interactions with people and computers. The GBS segment provides clients with consulting, application management services and global process services. The Technology Services & Cloud Platforms segment provides information technology infrastructure services. The Systems segment provides clients with infrastructure technologies. The Global Financing segment includes client financing, commercial financing, and remanufacturing and remarketing.
Related stocks
Premarket activity is a sign of manipulation So, I have done my research to pick the right moment to enter a trade, studies the market and earnings. Everything went well. The stock gone up for @IBM after the announcement. I am waiting to get some return on my money spent on this stock as a trader.
But then comes the premarket activity.
The
What is Run Gain Potential and how do you use itToday's tutorial is about Run Gain Potential and how to calculate it for daily candles and intraday minute candles. It is a very important part of determining how far a stock can run, whether the run gain has sufficient points for good profits, and whether or not the run gain potential is shrinking

IBM (IBM) Expands AI and Cloud Technology ReachInternational Business Machines Corporation (IBM) is a global technology and consulting leader specializing in hybrid cloud, AI, and enterprise IT solutions. The company’s platform helps organizations modernize infrastructure, enhance cybersecurity, and drive digital transformation. IBM’s growth is
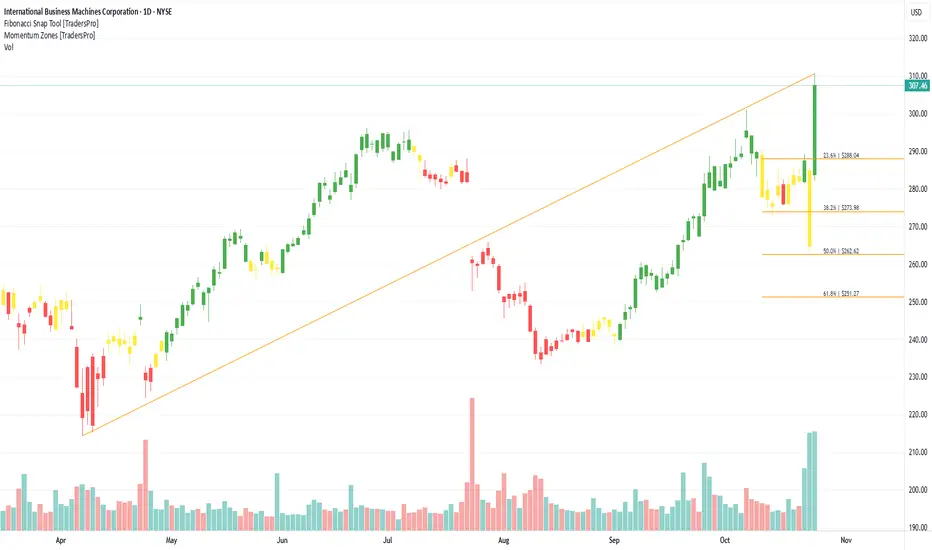
IBM Analysis – 28 October 2025
- IBM broke resistance zone
- Likely to rise to resistance level 320.00
IBM recently broke the resistance zone between the round resistance level 300.00 and the 296.00 (which stopped the previous impulse wave (3) in the middle of June).
The breakout of this resistance zone accelerated the active
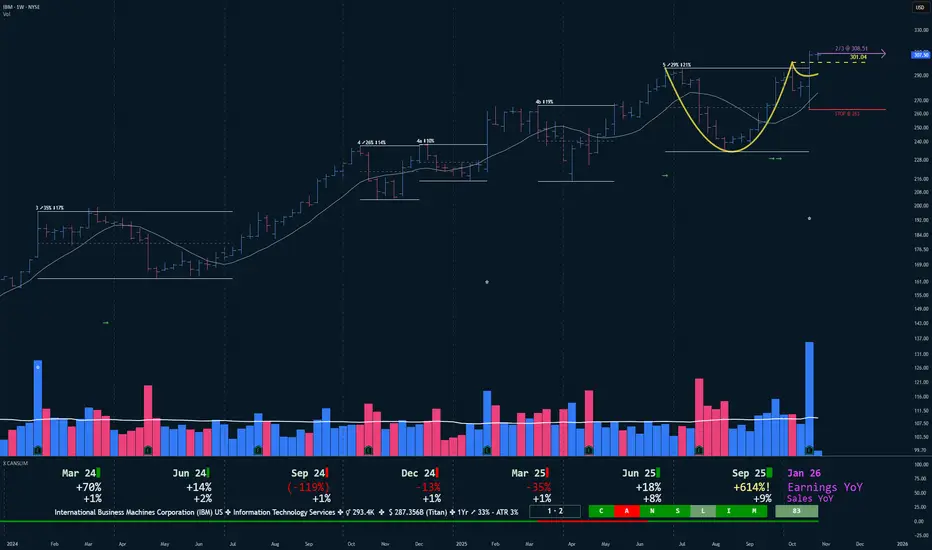
IBM just cleared a daily Cup with Handle on strong earningsKey points at the time of writing.
✣ New bull market cycle running since June 2025
✣ Market Direction is Up 90%
✣ Stock Fundamentals have just turned good.
✣ Institutional support with a buy/sell ratio of 1.3 and a ownership of 59%
✣ TTM Performance is 33%
I expect a more important upside move if

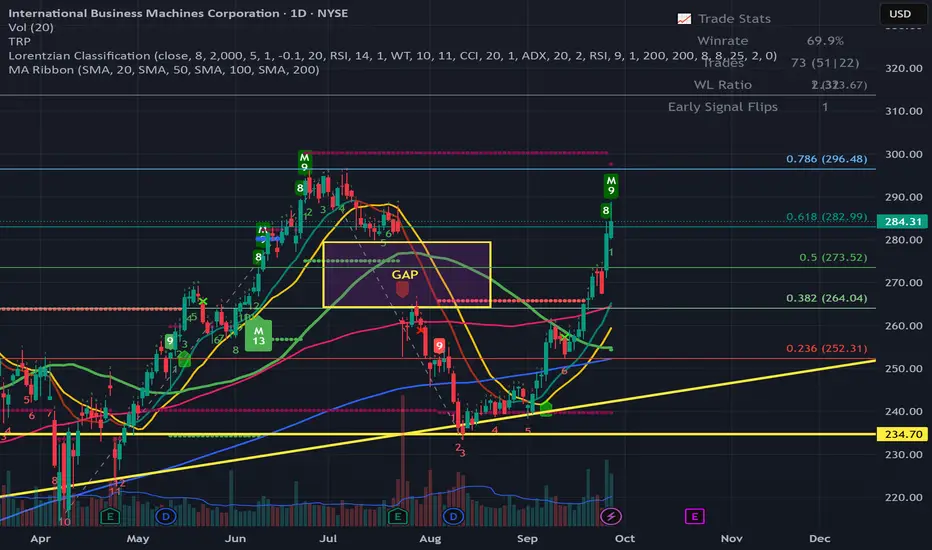
IBM - Closed the GAP, What is next?Hello Everyone, Followers,
In September 7th I shared below analysis and talked about possible GAP closure for IBM. Here is the link:
Approx %15 in 20 days , not bad :))
Now what is next for IBM:
Related to the Quantum Computing news support this move, as IBM is also working on the Quantum area a
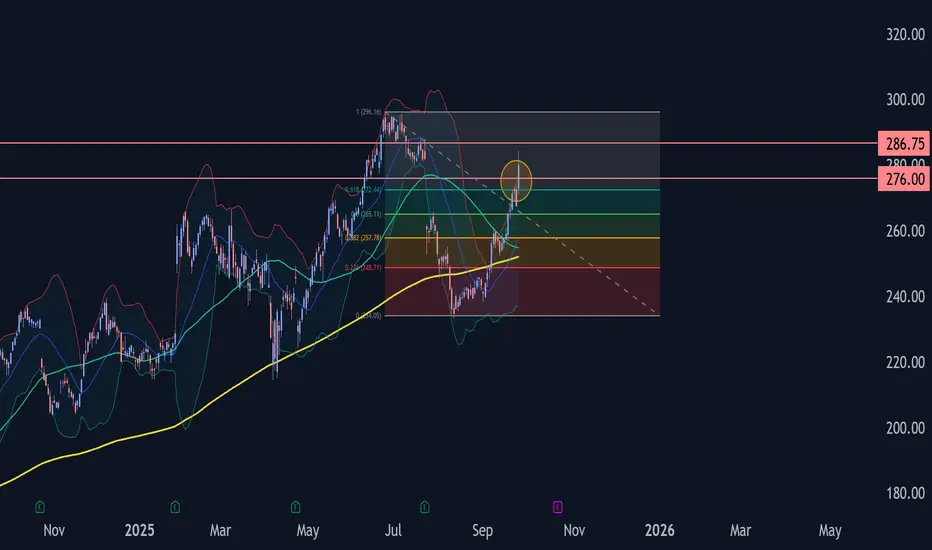
IBM Wave Analysis – 25 September 2025- IBM broke resistance area
- Likely to rise to resistance level 286.75
IBM recently broke the resistance area between the resistance level 276.00 and the 61.8% Fibonacci correction of the ABC correction (4) from June.
The breakout of this resistance area accelerated the active short-term impulse
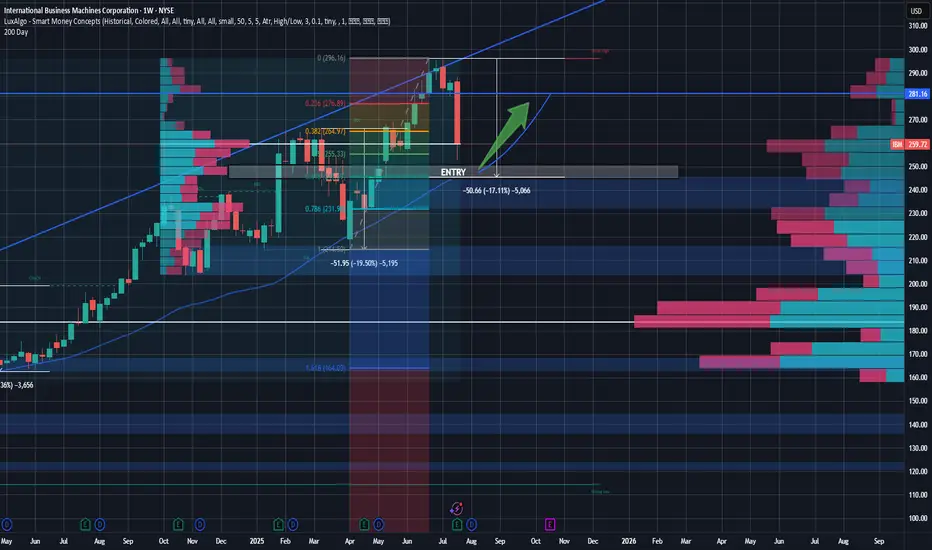
IBM Rebound Trade - Buying the Pullback at Key ConfluenceSetup:
IBM is setting up for a potential high-conviction long entry around the $245 level, a price zone marked by multiple layers of technical confluence and volume-based support. Over the last 18 months, IBM has seen two notable pullbacks—both in the 17–20% range, often around earnings events. The
See all ideas
Summarizing what the indicators are suggesting.
Neutral
SellBuy
Strong sellStrong buy
Strong sellSellNeutralBuyStrong buy
Neutral
SellBuy
Strong sellStrong buy
Strong sellSellNeutralBuyStrong buy
Neutral
SellBuy
Strong sellStrong buy
Strong sellSellNeutralBuyStrong buy
An aggregate view of professional's ratings.
Neutral
SellBuy
Strong sellStrong buy
Strong sellSellNeutralBuyStrong buy
Neutral
SellBuy
Strong sellStrong buy
Strong sellSellNeutralBuyStrong buy
Neutral
SellBuy
Strong sellStrong buy
Strong sellSellNeutralBuyStrong buy
Displays a symbol's price movements over previous years to identify recurring trends.
IBM.GW
International Business Machines Corporation 7.0% 30-OCT-2025Yield to maturity
6.56%
Maturity date
Oct 30, 2025
IBM.GY
International Business Machines Corporation 7.125% 01-DEC-2096Yield to maturity
5.65%
Maturity date
Dec 1, 2096
XS258374304
International Business Machines Corporation 4.875% 06-FEB-2038Yield to maturity
5.45%
Maturity date
Feb 6, 2038
IBM5449458
International Business Machines Corporation 4.9% 27-JUL-2052Yield to maturity
5.45%
Maturity date
Jul 27, 2052
IBM5354862
International Business Machines Corporation 3.43% 09-FEB-2052Yield to maturity
5.45%
Maturity date
Feb 9, 2052
IBM5999346
International Business Machines Corporation 5.7% 10-FEB-2055Yield to maturity
5.44%
Maturity date
Feb 10, 2055
I
IBM5744047
IBM International Capital Pte. Ltd. 5.3% 05-FEB-2054Yield to maturity
5.44%
Maturity date
Feb 5, 2054
US459200KC4
International Business Machines Corporation 4.25% 15-MAY-2049Yield to maturity
5.43%
Maturity date
May 15, 2049
IBM.GX
International Business Machines Corporation 7.0% 30-OCT-2045Yield to maturity
5.43%
Maturity date
Oct 30, 2045
IBM5534365
International Business Machines Corporation 5.1% 06-FEB-2053Yield to maturity
5.40%
Maturity date
Feb 6, 2053
IBM4983326
International Business Machines Corporation 2.95% 15-MAY-2050Yield to maturity
5.38%
Maturity date
May 15, 2050
See all IBM bonds
Curated watchlists where IBM is featured.


Frequently Asked Questions
The current price of IBM is 247.126 CHF — it has increased by 9.16% in the past 24 hours. Watch International Business Machines Corporation stock price performance more closely on the chart.
Depending on the exchange, the stock ticker may vary. For instance, on BX exchange International Business Machines Corporation stocks are traded under the ticker IBM.
IBM stock has risen by 12.87% compared to the previous week, the month change is a 7.86% rise, over the last year International Business Machines Corporation has showed a 32.35% increase.
We've gathered analysts' opinions on International Business Machines Corporation future price: according to them, IBM price has a max estimate of 278.53 CHF and a min estimate of 157.57 CHF. Watch IBM chart and read a more detailed International Business Machines Corporation stock forecast: see what analysts think of International Business Machines Corporation and suggest that you do with its stocks.
IBM stock is 0.35% volatile and has beta coefficient of 0.70. Track International Business Machines Corporation stock price on the chart and check out the list of the most volatile stocks — is International Business Machines Corporation there?
Today International Business Machines Corporation has the market capitalization of 232.84 B, it has increased by 0.35% over the last week.
Yes, you can track International Business Machines Corporation financials in yearly and quarterly reports right on TradingView.
International Business Machines Corporation is going to release the next earnings report on Jan 27, 2026. Keep track of upcoming events with our Earnings Calendar.
IBM earnings for the last quarter are 2.11 CHF per share, whereas the estimation was 1.95 CHF resulting in a 8.32% surprise. The estimated earnings for the next quarter are 3.44 CHF per share. See more details about International Business Machines Corporation earnings.
International Business Machines Corporation revenue for the last quarter amounts to 13.01 B CHF, despite the estimated figure of 12.82 B CHF. In the next quarter, revenue is expected to reach 15.30 B CHF.
IBM net income for the last quarter is 1.39 B CHF, while the quarter before that showed 1.74 B CHF of net income which accounts for −20.20% change. Track more International Business Machines Corporation financial stats to get the full picture.
Yes, IBM dividends are paid quarterly. The last dividend per share was 1.36 CHF. As of today, Dividend Yield (TTM)% is 2.14%. Tracking International Business Machines Corporation dividends might help you take more informed decisions.
International Business Machines Corporation dividend yield was 3.03% in 2024, and payout ratio reached 103.78%. The year before the numbers were 4.05% and 81.49% correspondingly. See high-dividend stocks and find more opportunities for your portfolio.
As of Oct 28, 2025, the company has 293.4 K employees. See our rating of the largest employees — is International Business Machines Corporation on this list?
EBITDA measures a company's operating performance, its growth signifies an improvement in the efficiency of a company. International Business Machines Corporation EBITDA is 14.04 B CHF, and current EBITDA margin is 24.48%. See more stats in International Business Machines Corporation financial statements.
Like other stocks, IBM shares are traded on stock exchanges, e.g. Nasdaq, Nyse, Euronext, and the easiest way to buy them is through an online stock broker. To do this, you need to open an account and follow a broker's procedures, then start trading. You can trade International Business Machines Corporation stock right from TradingView charts — choose your broker and connect to your account.
Investing in stocks requires a comprehensive research: you should carefully study all the available data, e.g. company's financials, related news, and its technical analysis. So International Business Machines Corporation technincal analysis shows the strong buy rating today, and its 1 week rating is strong buy. Since market conditions are prone to changes, it's worth looking a bit further into the future — according to the 1 month rating International Business Machines Corporation stock shows the strong buy signal. See more of International Business Machines Corporation technicals for a more comprehensive analysis.
If you're still not sure, try looking for inspiration in our curated watchlists.
If you're still not sure, try looking for inspiration in our curated watchlists.