CADJPY: TECHNICAL ANALYSIS.Hello traders,
Wave 3 has probably ended at 107.711 zone. Wave 4 is supposed to materialise
towards the resistance zone at 108.850-109.120. After that wave 5 is supposed
to materialise towards the support zone at 107.711-107.430.
Thanks.
CADJPY trade ideas

CAD/JPY continue with the Downtrend 👇On CAD/JPY is nice to see strong sell-off from the price 108.660, there are nice to see strong volume area....
Where is lot of contract accumulated...
I thing that sellers from this area will be defend this short position...
and when the price come back to this area, strong sellers will be push down the market again...
Downtrend + Strong volume area is my mainly reason for this short trade....
Happy trading
Dale

THE CLEAR PICTURE OF A STRONG LOONIEThe war continues giving and keeps taking, for each resource consumed, there is an energy wasted. A barrel burnt, sanctions placed on the Russians too. I could go on, the OANDA:CADJPY is set to bull once the BoJ's bluff is called tomorrow my time.

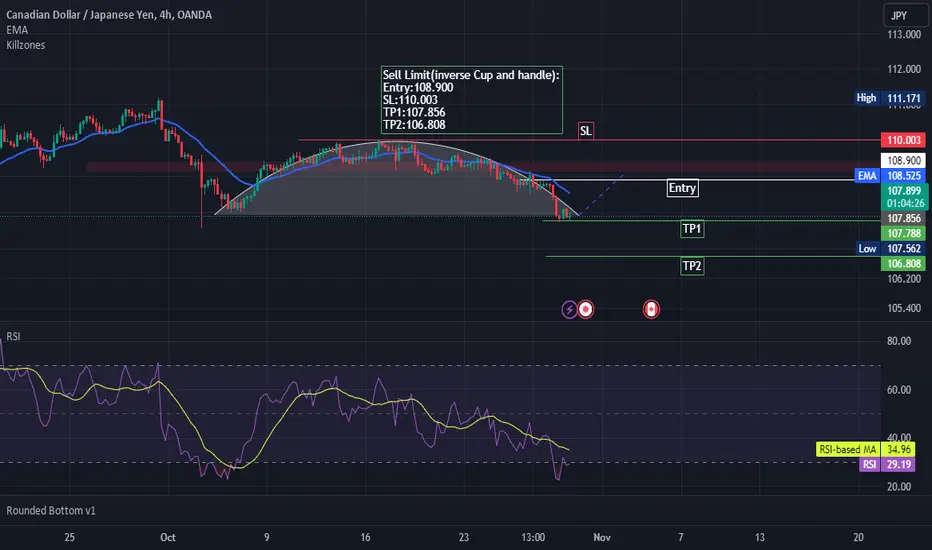
CADJPY bearish scenario-Inverse Cup and Handle chart pattern on 4H Tf.
-Entry point decided by nearest bearish order block.
Note: We can take a position according to our understanding, we can wait for the price to reach our entry-level, and wait and watch wether the defined levels be tested. after that, we can take positions.
CADJPY-RANGE strategy Daily chartMedium-term the pair has potential reaching 104.00 and we are well protected above 111.00 for strong sellers to come in. the short-term picture is range bound 106.25-109.30 sloping downwards. The stochastic is negative for sometime.
Strategy SELL @ 108.50-108.80 only, since some pullback is possible. Oil prices seems soft and therefore, the pair should side lower over time. It depends how deep your pockets are, when selling comes to mind. SL I suggest 0.50 above entry level.

CADJPY🔥🔥This pair is moving in a sweet channel for the buys...
After this retracement from sellers, we should probably aim high to 137k
Trade with caution 📉🧘📈

CADJPY 1WPotential for a bearish pullback on the CADJPY pair, which could lead to a price movement towards the support level at 101 in the upcoming period.

Keep shorting A pretty straight forward trade here. Price has broken out of the rising wedge and is headed for the demand zone at around the 38% Fib retracement.

CJ Sell 10/27Entry at the open of 10/27 - 108.743
SL just above open of the prior day
1st TP at 108.5
2nd at the daily (bullish) trend line
Final TP at/around psych level 108.0 - aiming for 108.111 for now as that looks like the start of an area of support

BUY CADJPY 💲💀💲 №282FX:CADJPY
Trading Forex and other financial products with leverage is highly risky and can result in substantial losses. Trading in the market may not be suitable for everyone. You need to be aware of all the risks and seek the help of independent financial advisors if you have any questions or doubt

CADJPY: Short scalp next weekThinking we're starting to see JPY strength, this is because it can't stay so weak for so long imho.
Weak currency suits Japan as an exporter, to a point, but massively affects it's buying power, I do feel like we're approaching the end of this cycle of Yen weakness, by the end of this year.
I think this pair broke the rising trendline but has struggled to get back in on multiple retracement attempts, so I think we'll drop to catch the order block in the next week based on current PA.

CADJPY Road mapCADJPY T is in a very good area that can start a strong downtrend
Do you think that the downward path can lead to a reversal of the trend in the medium term for this currency?

CADJPYCADJPY is trading in descending channel and printing consistent LLs LHs. Recently the price is broken the important support zone and now retesting the broken level, which is also the 50% Fib retracement level.
If the sell momentum continues the next target could be 108.50 followed by 107.50 region.
What you guys think of this idea

CADJPY short After today BOC rate decision, due the bad economic oulook, maybe first country in to the technical recession, after last week GDP, we expect as bank to keep rate unchanged and that will be a good incentive for the market to CAD. even a higher price of OIL who still keep CAD currency at the top the decline is started already.
from a technical perspective we see first impulse created and a big daily flag correction, with a very waisted MACD who suggest price will decline further.
We still can see the price around 108.5 in to the blocks but 99% will not make a new high to the D market structure changed few months ago in almost all Yen pairs.
Bear in minds that we are in a very big retracement what is almost done, we need weeks or days, i am very confident that the CadJpy have not more room for upside.

CADJPY Cup and Handel PatternCADJPY show a beautiful cup and handle Pattern and we assume if price trigger this sell stop we hope it will go down. Risk Reward according to your account health.
Safe Trade Stay Healthy.

CAD/JPY Short1. Price at resistance
2. RSI direction is the opposite of the price direction, divergence??
Simple.

CADJPY BUYHello Traders, here is the full analysis.
Watch strong action at the current levels for BUY! Great BUY opportunity CADJPY!
Support the idea with like or follow my profile TO SEE MORE.

CADJPY BUY | Day Trading Analysis With Volume ProfileHello Traders, here is the full analysis.
Watch strong action at the current levels for BUY . GOOD LUCK! Great BUY opportunity CADJPY
I still did my best and this is the most likely count for me at the moment.
Support the idea with like and follow my profile TO SEE MORE.
Traders, if you liked this idea or if you have your own opinion about it, write in the comments. I will be glad 🤝
Patience is the If You Have Any Question, Feel Free To Ask 🤗
Just follow chart with idea and analysis and when you are ready come in THE GROVE | VIP GROUP, earn more and safe, wait for the signal at the right moment and make money with us💰

CADJPY Short From Resistance!CAD-JPY is going up
To retest the resistance at 109.693
And the pair is locally overbought
So I think that we will see
A local bearish correction
After the pair hits the resistance

CADJPYCADJPY sell bias
hello traders i bring to you the pair have been watching for a while now and its in my area of interest to enter a short position, the reason i'm selling is we have two consecutive trendline breakout and retest with the 200 and 50 MA staying above the price level, but i will execute my short position if the current 4hr candle closes bearish
my exit price is 109.598 if it didn't go as planned and my tp is 108.463
Trade safe guys
Ambafx

Triangle pattern analysis on CADJPY currency pairThe CADJPY currency pair has been trading in a triangle pattern for the past few weeks. The triangle pattern is a neutral pattern, which means that it can break out in either direction. However, there are a few things that traders can look for to determine which direction the pair is likely to break out.
One thing to look for is the slope of the triangle pattern. If the triangle pattern is sloping upwards, it is more likely to break out to the upside. If the triangle pattern is sloping downwards, it is more likely to break out to the downside.
Another thing to look for is the volume. If the volume is increasing as the price approaches the top of the triangle pattern, it is a sign that there is more buying pressure and that the pair is likely to break out to the upside. If the volume is increasing as the price approaches the bottom of the triangle pattern, it is a sign that there is more selling pressure and that the pair is likely to break out to the downside.
Finally, traders can also look for other technical indicators to confirm the direction of the breakout. For example, if the MACD indicator is crossing bullishly, it is a sign that the pair is likely to break out to the upside. If the MACD indicator is crossing bearishly, it is a sign that the pair is likely to break out to the downside.
Analysis of the CADJPY chart
The CADJPY chart shows that the pair is trading in a symmetrical triangle pattern. This means that the slope of the triangle pattern is neither upwards nor downwards. Additionally, the volume has been relatively low recently.
This suggests that the pair is likely to remain in the triangle pattern for a while longer. However, if the volume does start to increase and the price approaches one of the sides of the triangle pattern, traders should be prepared for a breakout.
Trading strategy
One possible trading strategy is to wait for the pair to break out of the triangle pattern before placing a trade. If the pair breaks out to the upside, traders could place a buy order above the resistance level. If the pair breaks out to the downside, traders could place a sell order below the support level.
Another possible trading strategy is to place a trade within the triangle pattern. For example, traders could place a buy order at the support level and place a stop loss order below the support level. If the pair breaks out to the downside, traders would lose money on the trade. However, if the pair bounces back from the support level, traders could profit from the trade.
It is important to note that both of these trading strategies are risky and there is no guarantee of profit. Traders should always use a stop loss order to limit their losses.
Conclusion
The CADJPY currency pair is trading in a triangle pattern. This means that the pair is likely to break out in either direction. Traders should look for the slope of the triangle pattern, the volume, and other technical indicators to determine which direction the pair is likely to break out.

Potential Short SetupConfluences:
- Price Touches Weekly key level
- Market structure shift on 4h with supply and displacement
Goodluck and Keep on fighting!

CADJPY BUY (Bullish)I have a Bullish Stance on the CADJPY.
- Previous Day High Broken - indicating higher price ( or it could be a false break... )
- Wait for Retracement towards Consolidation Area Prior to Breakout that took out Previous Day High.
- 1:25+ RR (23 pips risk/60+pips Reward)
- TP Area - Between 110.00 and 109.900
Use at own risk. Am a Rookie!
( I have a Bearish idea for USDCAD as well...I am waiting for price to break previous day's low...however, no break, no trade! )
