CADJPY Road mapCADJPY T is in a very good area that can start a strong downtrend
Do you think that the downward path can lead to a reversal of the trend in the medium term for this currency?
CADJPY trade ideas

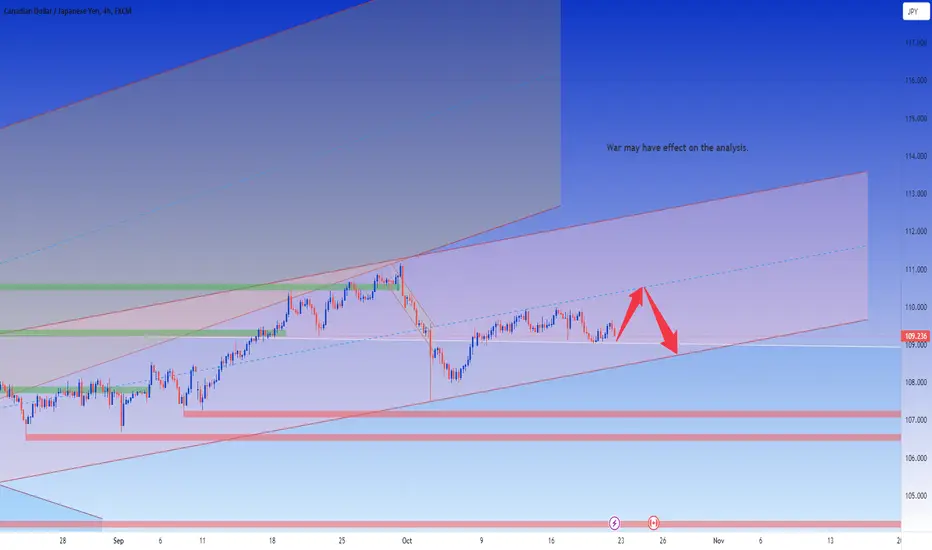
CADJPYCADJPY is trading in descending channel and printing consistent LLs LHs. Recently the price is broken the important support zone and now retesting the broken level, which is also the 50% Fib retracement level.
If the sell momentum continues the next target could be 108.50 followed by 107.50 region.
What you guys think of this idea

CADJPY short After today BOC rate decision, due the bad economic oulook, maybe first country in to the technical recession, after last week GDP, we expect as bank to keep rate unchanged and that will be a good incentive for the market to CAD. even a higher price of OIL who still keep CAD currency at the top the decline is started already.
from a technical perspective we see first impulse created and a big daily flag correction, with a very waisted MACD who suggest price will decline further.
We still can see the price around 108.5 in to the blocks but 99% will not make a new high to the D market structure changed few months ago in almost all Yen pairs.
Bear in minds that we are in a very big retracement what is almost done, we need weeks or days, i am very confident that the CadJpy have not more room for upside.

CADJPY Cup and Handel PatternCADJPY show a beautiful cup and handle Pattern and we assume if price trigger this sell stop we hope it will go down. Risk Reward according to your account health.
Safe Trade Stay Healthy.

CAD/JPY Short1. Price at resistance
2. RSI direction is the opposite of the price direction, divergence??
Simple.

CADJPY BUYHello Traders, here is the full analysis.
Watch strong action at the current levels for BUY! Great BUY opportunity CADJPY!
Support the idea with like or follow my profile TO SEE MORE.

CADJPY BUY | Day Trading Analysis With Volume ProfileHello Traders, here is the full analysis.
Watch strong action at the current levels for BUY . GOOD LUCK! Great BUY opportunity CADJPY
I still did my best and this is the most likely count for me at the moment.
Support the idea with like and follow my profile TO SEE MORE.
Traders, if you liked this idea or if you have your own opinion about it, write in the comments. I will be glad 🤝
Patience is the If You Have Any Question, Feel Free To Ask 🤗
Just follow chart with idea and analysis and when you are ready come in THE GROVE | VIP GROUP, earn more and safe, wait for the signal at the right moment and make money with us💰

CADJPY Short From Resistance!CAD-JPY is going up
To retest the resistance at 109.693
And the pair is locally overbought
So I think that we will see
A local bearish correction
After the pair hits the resistance

CADJPYCADJPY sell bias
hello traders i bring to you the pair have been watching for a while now and its in my area of interest to enter a short position, the reason i'm selling is we have two consecutive trendline breakout and retest with the 200 and 50 MA staying above the price level, but i will execute my short position if the current 4hr candle closes bearish
my exit price is 109.598 if it didn't go as planned and my tp is 108.463
Trade safe guys
Ambafx

Triangle pattern analysis on CADJPY currency pairThe CADJPY currency pair has been trading in a triangle pattern for the past few weeks. The triangle pattern is a neutral pattern, which means that it can break out in either direction. However, there are a few things that traders can look for to determine which direction the pair is likely to break out.
One thing to look for is the slope of the triangle pattern. If the triangle pattern is sloping upwards, it is more likely to break out to the upside. If the triangle pattern is sloping downwards, it is more likely to break out to the downside.
Another thing to look for is the volume. If the volume is increasing as the price approaches the top of the triangle pattern, it is a sign that there is more buying pressure and that the pair is likely to break out to the upside. If the volume is increasing as the price approaches the bottom of the triangle pattern, it is a sign that there is more selling pressure and that the pair is likely to break out to the downside.
Finally, traders can also look for other technical indicators to confirm the direction of the breakout. For example, if the MACD indicator is crossing bullishly, it is a sign that the pair is likely to break out to the upside. If the MACD indicator is crossing bearishly, it is a sign that the pair is likely to break out to the downside.
Analysis of the CADJPY chart
The CADJPY chart shows that the pair is trading in a symmetrical triangle pattern. This means that the slope of the triangle pattern is neither upwards nor downwards. Additionally, the volume has been relatively low recently.
This suggests that the pair is likely to remain in the triangle pattern for a while longer. However, if the volume does start to increase and the price approaches one of the sides of the triangle pattern, traders should be prepared for a breakout.
Trading strategy
One possible trading strategy is to wait for the pair to break out of the triangle pattern before placing a trade. If the pair breaks out to the upside, traders could place a buy order above the resistance level. If the pair breaks out to the downside, traders could place a sell order below the support level.
Another possible trading strategy is to place a trade within the triangle pattern. For example, traders could place a buy order at the support level and place a stop loss order below the support level. If the pair breaks out to the downside, traders would lose money on the trade. However, if the pair bounces back from the support level, traders could profit from the trade.
It is important to note that both of these trading strategies are risky and there is no guarantee of profit. Traders should always use a stop loss order to limit their losses.
Conclusion
The CADJPY currency pair is trading in a triangle pattern. This means that the pair is likely to break out in either direction. Traders should look for the slope of the triangle pattern, the volume, and other technical indicators to determine which direction the pair is likely to break out.

Potential Short SetupConfluences:
- Price Touches Weekly key level
- Market structure shift on 4h with supply and displacement
Goodluck and Keep on fighting!

CADJPY BUY (Bullish)I have a Bullish Stance on the CADJPY.
- Previous Day High Broken - indicating higher price ( or it could be a false break... )
- Wait for Retracement towards Consolidation Area Prior to Breakout that took out Previous Day High.
- 1:25+ RR (23 pips risk/60+pips Reward)
- TP Area - Between 110.00 and 109.900
Use at own risk. Am a Rookie!
( I have a Bearish idea for USDCAD as well...I am waiting for price to break previous day's low...however, no break, no trade! )

CADJPY Top-down analysis Hello traders, this is a complete multiple timeframe analysis of this pair. We see could find significant trading opportunities as per analysis upon price action confirmation we may take this trade. Smash the like button if you find value in this analysis and drop a comment if you have any questions or let me know which pair to cover in my next analysis.

CADJPY - In Bearish TrendCADJPY is in Bearish Trend, We have two nearest supports first on 109.159 and second one on 108.961 . We will take entry after the break of Support 2. And our stop loss should be on above the Support 1. If it breaks its Second support then the next support would be on 108.142 .
We want three confirmations on this trade setup:
1) Bearish Trend
2) Break Of Support Two.
3) Have No bullish divergence.
HAPPY TRADING :)

CADJPY: BEST TRADE ON WEDNESDAY BoC GAME CHANGER is all more to expect. A retracement breaking friday's high would prove premium prices to sell

CADJPY Trading IdeaBased on Simple Technical Analysis ( Trendline + Support & Resistance )
Risk Disclaimer:
Please be advised that I am not telling anyone how to spend or invest their money. Take all of my analysis as my own opinion, as entertainment, and at your own risk. I assume no responsibility or liability for any errors or omissions in the content of this page, and they are for educational purposes only. Any action you take on the information in these analysis is strictly at your own risk. There is a very high degree of risk involved in trading. Past results are not indicative of future returns. Good luck :-)