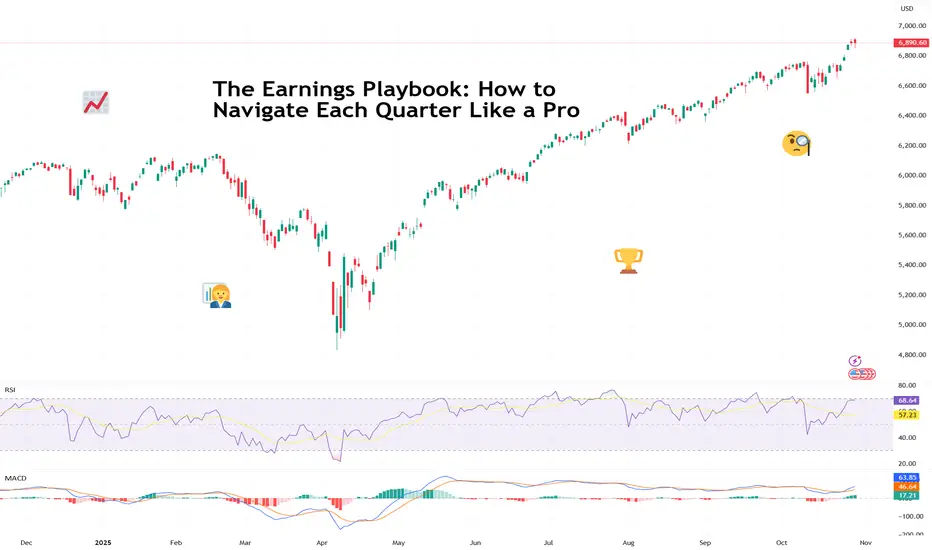
The Earnings Playbook: How to Navigate Each Quarter Like a ProTraders are in the heat of the earnings season and euphoria is sweeping every corner of the market.
The charts twitch, traders stop talking about the Fed for five minutes ( not this week, though ), and online forums turn into a parade of watch-me-trade sessions.
It’s that glorious stretch when c
About S&P 500 Index
Standard and Poor's 500 Index is a capitalization-weighted stock market index measuring the performance of 500 large publicly traded companies in the United States. This index covers a wide range of industries, including technology, healthcare, energy, and finance. It serves as a benchmark for the overall health of the U.S. stock market, as well as a reflection of the country's economic strength.
Substantial gains in the S&P 500 are often interpreted as positive signals for the economy, while losses can be seen as indicators of potential trouble. Investors use this index as a barometer for their own portfolios and to assess the performance of individual stocks. The S&P 500 index plays a vital role in the financial world and is closely watched by analysts and policymakers.
Substantial gains in the S&P 500 are often interpreted as positive signals for the economy, while losses can be seen as indicators of potential trouble. Investors use this index as a barometer for their own portfolios and to assess the performance of individual stocks. The S&P 500 index plays a vital role in the financial world and is closely watched by analysts and policymakers.
Related indices
Peak Tech Earnings Wrapped Up: Here Are the Winners and LosersWe're past that time when we all get glued to the dual-monitor setup and watch the titans of tech parade their financials.
Last week was the Super Bowl of earnings season, with Meta NASDAQ:META , Microsoft NASDAQ:MSFT , Alphabet NASDAQ:GOOGL , Apple NASDAQ:AAPL , and Amazon NASDAQ:AMZN all re

S&P 500 Index Showing Weakness – Correction Ahead?Over the past seven days, the S&P 500 index( SP:SPX ) has been on a bullish run, frequently hitting new all-time highs. However, in the last two or three weeks, it's been influenced by the ongoing tariff tensions between the U.S. and China .
Let's look at the latest news about the S&P 500 ind

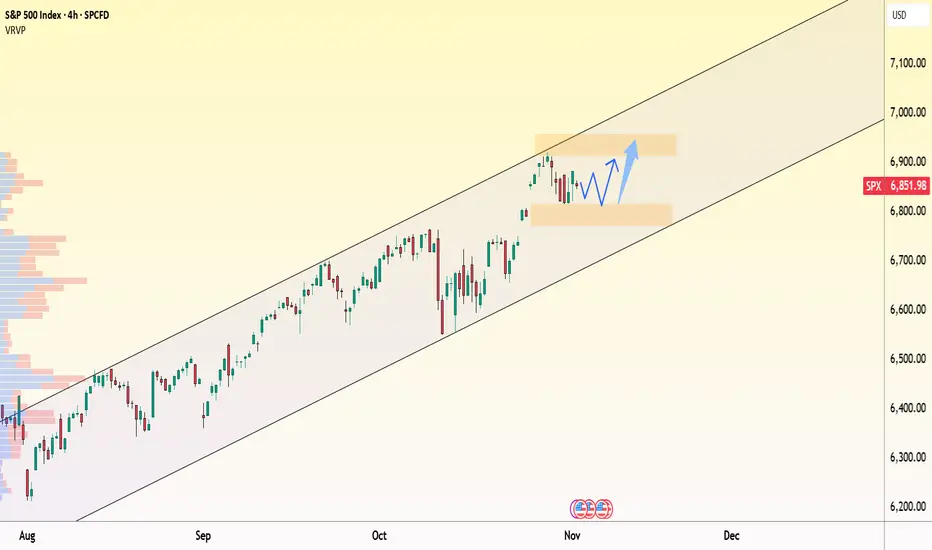
SPX:uptrend remains intact – consolidating for the next breakoutOn the 4-hour chart, the S&P 500 (SPX) continues to move firmly within its ascending channel , with the current range around 6,850–6,900 representing a healthy pause after a strong rally. The nearest support sits at 6,800, where buyers previously stepped in, while short-term resistance remains near
Hellena | SPX500 (4H): LONG to resistance area of 7000.Colleagues, I believe that the upward movement is not over yet and at the moment the formation of wave “3” is taking place, but the chart shows a gap that should be closed.
Therefore, I believe that the price can go into correction of the small wave “4” to the area of 6823, but the priority is stil

Larger Drop Incoming?The move up since the liberation day dump has been epic. I called the low on the markets at the time. I was long AppLovin, AMD, Reddit, Arm, Alab, REMX, amongst many other names that far outperformed the market. I warned you about the imminent dump before it happened, and then took positions on the

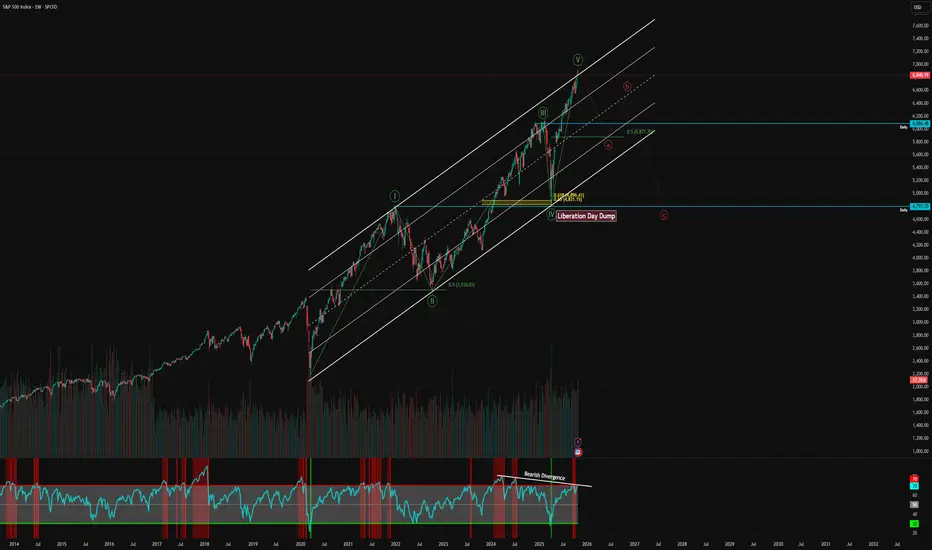
S&P500 Is it approaching the end of this Cycle?The S&P500 index (SPX) has been trading within a Bullish Megaphone pattern since the October 2022 bottom of the Inflation Crisis. Since the July 2024 High, it also entered a shorter term Megaphone and those two patterns resemble the 2016 - 2019 Megaphones that emerged straight after the 2015 E.U. cr

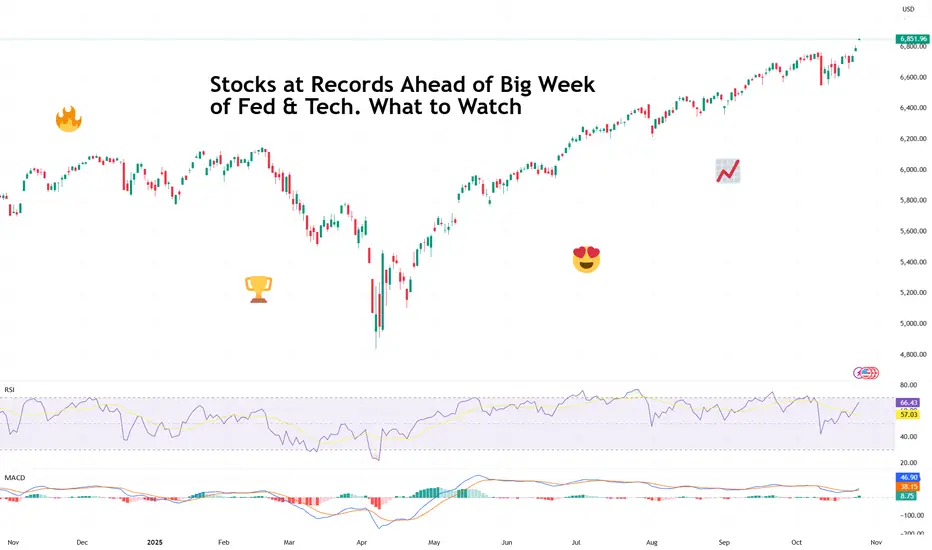
Stocks at Records Ahead of Big Week of Fed & Tech. What to WatchRecord highs, rate-cut optimism, five tech giants on deck — what a time to be a market participant!
It’s Monday, and Wall Street is back doing what it does best — setting new records and pretending not to worry about what comes next.
After a cooler-than-expected inflation print and some diplomat
Backtesting 101: How to Turn an Idea Into a Tested StrategyEvery trader has thought it:
“If I’d just followed that setup every time, I’d be up big.”
That’s where backtesting steps in, it separates luck from logic.
It’s how you find out whether your strategy has a real edge, or just worked in hindsight.
Most traders skip it, not because it’s useless, but bec

Topping Signal?To me this looks like Wave 5 of the Elliott Wave supercycle in the stock market. We had a monster rally since the liberation day dump, now we are coming up against some strong resistance.
Should we be concerned? So far I have taken a lot of chips of the table. I am still very much long, we don't f
See all ideas
Summarizing what the indicators are suggesting.
Oscillators
Neutral
SellBuy
Strong sellStrong buy
Strong sellSellNeutralBuyStrong buy
Oscillators
Neutral
SellBuy
Strong sellStrong buy
Strong sellSellNeutralBuyStrong buy
Summary
Neutral
SellBuy
Strong sellStrong buy
Strong sellSellNeutralBuyStrong buy
Summary
Neutral
SellBuy
Strong sellStrong buy
Strong sellSellNeutralBuyStrong buy
Summary
Neutral
SellBuy
Strong sellStrong buy
Strong sellSellNeutralBuyStrong buy
Moving Averages
Neutral
SellBuy
Strong sellStrong buy
Strong sellSellNeutralBuyStrong buy
Moving Averages
Neutral
SellBuy
Strong sellStrong buy
Strong sellSellNeutralBuyStrong buy
Displays a symbol's price movements over previous years to identify recurring trends.
Frequently Asked Questions
The current value of S&P 500 Index is 6,793.01 USD — it has fallen by −0.86% in the past 24 hours. Track the index more closely on the S&P 500 Index chart.
S&P 500 Index reached its highest quote on Oct 29, 2025 — 6,920.34 USD. See more data on the S&P 500 Index chart.
The lowest ever quote of S&P 500 Index is 2.73 USD. It was reached on Jun 1, 1877. See more data on the S&P 500 Index chart.
S&P 500 Index value has decreased by −1.52% in the past week, since last month it has shown a 1.05% increase, and over the year it's increased by 18.65%. Keep track of all changes on the S&P 500 Index chart.
The top companies of S&P 500 Index are NASDAQ:NVDA, NASDAQ:AAPL, and NASDAQ:MSFT — they can boast market cap of 5.03 T USD, 3.98 T USD, and 3.84 T USD accordingly.
The highest-priced instruments on S&P 500 Index are NYSE:NVR, NASDAQ:BKNG, and NYSE:AZO — they'll cost you 7,072.32 USD, 5,030.55 USD, and 3,576.14 USD accordingly.
The champion of S&P 500 Index is NASDAQ:HOOD — it's gained 520.59% over the year.
The weakest component of S&P 500 Index is NYSE:FI — it's lost −67.15% over the year.
S&P 500 Index is just a number that lets you track performance of the instruments comprising the index, so you can't invest in it directly. But you can buy S&P 500 Index futures or funds or invest in its components.
The S&P 500 Index is comprised of 503 instruments including NASDAQ:NVDA, NASDAQ:AAPL, NASDAQ:MSFT and others. See the full list of S&P 500 Index components to find more opportunities.