(ZN1!): The Wedge of Decision. Rate Cut Confirmation Imminent ?The Core Thesis: The 10-Year T-Note futures price has been locked in a massive, multi-year symmetrical triangle or falling wedge pattern. A decisive breakout from this formation will not only determine the next phase of the bond market but will also confirm the direction of the 10-Year Yield, which
Related futures

10-Year Treasuries Into FOMC: What to Expect1. Big Picture: What’s Been Driving Bonds?
Over the past several months, the U.S. Treasury market has been defined by diverging forces across the curve, the short end (2Y, 5Y) pricing near-term monetary policy outcomes and the long end (10Y, 30Y) reflecting inflation persistence, fiscal supply, an

Projecting Interest Rates Beyond the Current Fed RegimeCBOT: 10-Year T-Notes Futures ( CBOT:ZN1! )
Since hitting an all-time high (ATH) of 48,431 on November 12th, the Dow Jones Industrial Average lost 1,841 points, or -3.8%, to 46,590 on Monday.
Meanwhile, the Nasdaq Composite has lost over 1,300 points, or -5.5%, from its ATH of 24,020. The S&P 500

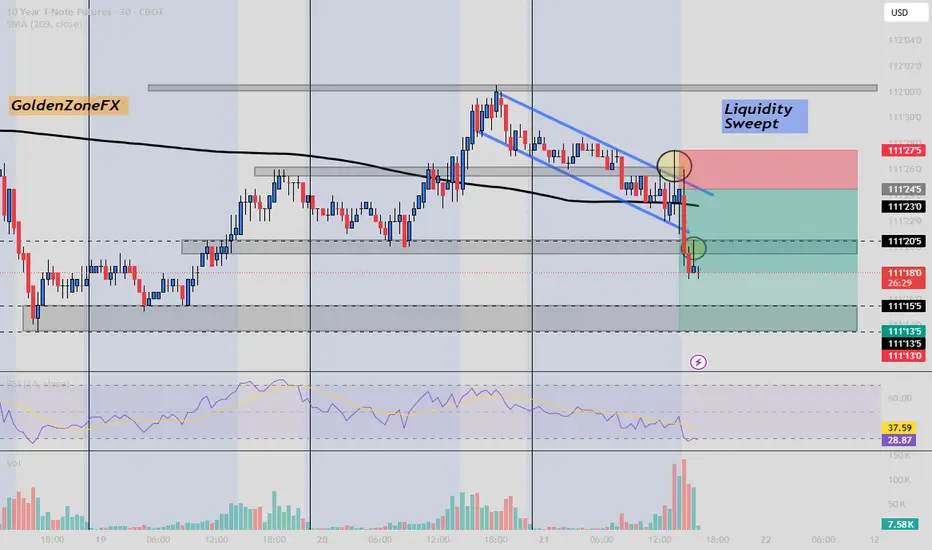
ZN Bearish Move Might Steps In?After the breakout and the liquidity that has been sweept the price performed a small pullback which confirms the short position setup.
Follow @GoldenZoneFX for more content and valuable insights.
When a Quant Tries to Be Tori Trades for a DayI’ve been experimenting with a wide range of strategies from full quant models to pure price action, from EAs to structure-based setups. Recently, I came across Tori Trades’ trend line method, and I was intrigued. It’s clean, visual, and grounded in logic: draw structure, follow the reaction, keep i

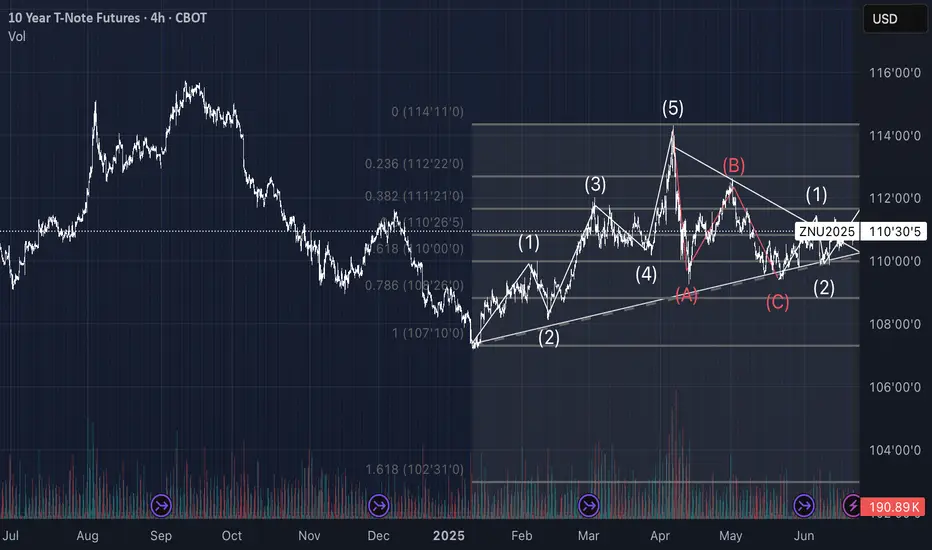
10 - Notes CallTechnical analysis of 10Y T-Note Futures (ZN1!) on 4H timeframe
Elliott Wave count with Fibonacci retracements and completed A-B-C corrective structure. Currently observing potential start of new impulsive wave (1)-(2). Breakout from descending triangle confirmed above dynamic support. Monitoring fo
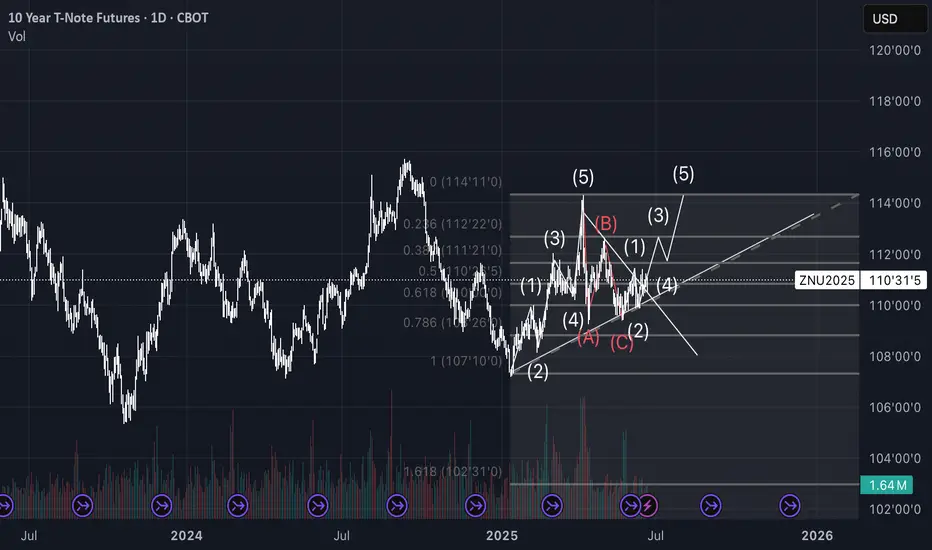
10 - NotesTechnical analysis of 10Y T-Note Futures (ZN1!) on 4H timeframe
Elliott Wave count with Fibonacci retracements and completed A-B-C corrective structure. Currently observing potential start of new impulsive wave (1)-(2). Breakout from descending triangle confirmed above dynamic support. Monitoring fo
How to Trade the Commitment of Traders Report Part 1Hey Traders so today I wanted to start a 3 part series on how to use the Commitment of Traders report to help you in your trading.
Enjoy!
Hope This Helps Your Trading 😃
Clifford

US 10 YR. T-NOTE 4 HR./ CORRECTIVE WAVE 4 IS LIKELY OVER!1). Price is very likely heading towards the fair Market value @ 107. 2). Risk Assets are Weak today on US$ strength! 3). BANKS ARE SELLING! 4). Volume is dropping. 5). Trendline is intersecting with target fib. level 50% TOWARDS 107! 6). Corrective wave 4 is likely dropping to complete wave 5. 7).

Steepening Yields & Uncertainty: What says the Bond Markets?
CBOT:ZN1!
US Yield Curve in Image Above
Showing yields on May 27, 2024 vs May 27, 2025 . What happened in a year and how to understand this?
Looking at the image above, the yield curve was inverted on this day last year. Comparing last year’s term structure to today’s, we can see t

See all ideas
A representation of what an asset is worth today and what the market thinks it will be worth in the future.
Displays a symbol's price movements over previous years to identify recurring trends.
Frequently Asked Questions
The nearest expiration date for 10-Year T-Note Futures (Sep 2021) is Sep 21, 2021.
Traders prefer to sell futures contracts when they've already made money on the investment, but still have plenty of time left before the expiration date. Thus, many consider it a good option to sell 10-Year T-Note Futures (Sep 2021) before Sep 21, 2021.