High Risk CELRUSDTPERP Short on the hourly chartI am not taking this signal, but here's a high risk short. High risk because of BTC's weekly position. Nevertheless, this is an 8X short with liquidation as the SL and 3 TPs on the chart.
CELRUSDT trade ideas

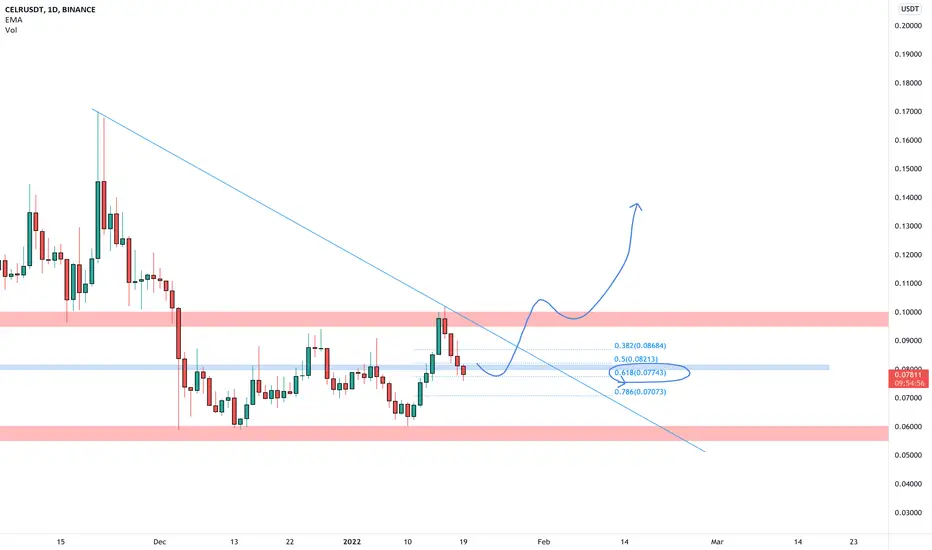
Bullish Run is coming.#CelrUsdt
After the retest, A rapid run will take place as bulls are fighting.
TP 0.14
TP 0.19

CELRUSDT is testing the 0.618 Fibonacci levelThe price created a double bottom on the weekly support ( the red one on 0.06) and now the price is testing the 0.618 Fibonacci level.
The price could create a new higher low.
How To approach?
IF the price is going to have a breakout from the weekly resistance (0.1) we can put on our watchlist and apply our rules
–––––
Follow the Shrimp 🦐
Keep in mind.
🟣 Purple structure -> Monthly structure.
🔴 Red structure -> Weekly structure.
🔵 Blue structure -> Daily structure.
🟡 Yellow structure -> 4h structure.
Celr Prediction! Now picture is a bit more clear! Past couple of months alt coins has been punished by BTC right and left. However I have a feeling that things may be about to change. Btc already touched down 40k once and flirting by 41-42k range at the time of writing. My personal opinion this level most likely will hold or we may see a bit of wick towards 38k then resume the bull trend towards 70k-80k. Either way current situation should be temporary. I don't expect any low 30k crashes but no one can be 100% sure.
I feel like C-bridge is one of the key element for this space and it is underpriced. It's useability and advantages over the competition clearly offers freedom and affordability so traders can move their coins between different networks within the crypto space. Daily transaction value does not lie!

Celer short callLooking at this price action unfold. Price broke a key structural level and both the 50 and 100 EMA. On the lower timeframes (1H & 4H) we can see the bulls are fighting to reclaim this support zone.
If we can hold price below it and maybe get a retest on the 4H-chart, this could be an interesting entry for a short position.
With a conservative target at $0.05 and an aggressive target at $0.04.
Would you take this?


Celr ready for 100%+ moveSo far Celr is following this wyckoff accumlation patern to the teeth. According to the model the next move will be a big one!
What do you think?


$CELR Buy now Sell at $0.1 35% ProfitBuy CELR now and Sell 50% and $0.1
Bullish flag
Sell the rest at $0.16
Stop Loss $0.66

CELER Network 1D TA : 01.15.22 : $CELRAll supports and resistances are marked on the chart. As we can see, the price is in an important range and recommended to keep an eye on it ...
Follow our other analysis & Feel free to ask any questions you have, we are here to help.
⚠️ This Analysis will be updated ...
👤 Arman Shaban : @ArmanShabanTrading
📅 15.Jan.22
⚠️(DYOR)
❤️ If you apperciate my work , Please like and comment , It Keeps me motivated to do better ❤️


Celer network I think it's time to go short on celer
Tp 0.07800
Considering 4h time frame there is no power for uptrend continuation
A retest to 0.078 is necessary in my perspective

CELRUSDTThe remarkable correlation between CELR and FTM has made the situation attractive for CELR price increases.

r:3.85 sell ideacrab pattern
parallel channel
rsi divergence
never risk more than 2% of capital per trade

CELR/USDT pair look bullish?If it can break the Fib 0.18,
It may create new ATH?
Look for two times correction.
Last time drpped around 80%. This time dropped around 70%.
I think the correction is completed and moon soon.
If look for the daily chart,
W chart pattren created and Fib 0.786 is strong support.
This is not financial advice. Just my point of view.
You're welcome to leave your comment if you want further discussion.

CELR-USDT LONG/BUYMulti-time Frame Analysis.
Entry=0.81-0.87, SL=0.64, TP1=0.12, TP2=0.19, TP3=0.23. R/R=8.8
Good luck with your trading !

CELRUSD - Double Bottom Possible??Celer Network is setting up fora perfect double bottom that could work very nicely in confluence with a flip of the SuperTrend. If Celr can flip the resistance on top of this double bottom pattern then we will see uptrend started with 0.1 being a nice first target.
I have covered the BTC pair before but that is looking really nice right now. Target initially is the midrange at ~300 sats.
The narrative isn't quite there yet but Layer 2/Bridges are starting to be talked about due to Eth being unusable.


UPDATE: CELR UP 32% after 4h bull signal - Scalper AnalysisPlease Like or Follow if you enjoyed this content.
UPDATE: The price jumped 32% after bull signal. CELR broke resistance at 0.075. Now moving slowly to 0.09 USDT. RSI is above 70. Price is above Ichimoku cloud. Which are all bullish signals.
This analysis is made with my "Supertrend Ninja - Clean". It displays only the last few signals. Which gives it a clean look. Currently CELR is in an uptrend. Remember you don't need to buy the bottom. You just need to ride a big part of the uptrend.
Supports and Resistances are highlighted as grey blocks. Profits can be taken at each grey block. Supports and resistances are automatically drawn using my indicator "Yo Show Me Some Support - and Resistances". Pun intended.
Thank you for reading.
Namasté 🙏
What Indicators Do I Use:
In the chart I am using my "Supertrend Ninja - indicator", which is a trend-following indicator (Green and red vertical line with arrows). When the background of the candlestick closes green (vertical line) with an upwards pointing pink arrow. It indicates a possible bullish (up)trend.
With each trade proper risk management is essential. Either by using my script "Trailing Stoploss Bottom Activation indicator", visible as grey dots below the candles. Which sends an alert, when current price goes below the previous candle low. Or using my "HA Trailing Stoploss Activation", the indicator below with green and red blocks. Or third option, exit when the Supertrend Ninja indicator displays a vertical red line with a downwards pointing black arrow. Remember, the first stop(loss) is always the cheapest stop.
Disclaimer: Ideas are for entertainment purposes only. Not financial advice. Your own due diligence is highly advised before entering trades. Past performance is no guarantee of future returns.

CELRUSDT SETUPCELRUSDT is consolidating in a rectangular box. It has a good potential to break the shackles and reach to the top.
Alternatively, the consolidation can break to downward as well.
Trade your levels accordingly.
