Bitcoin Needs To Roll Over Soon To Avoid Short-Covering RallyWhile I believe Bitcoin still has further downside potential in the coming weeks, there’s also scope for a near-term bounce based on how futures traders are currently positioned.
Matt Simpson, Market Analyst at City Index and Forex.com.
Trade ideas

Why I'm Suspicious Of This Bitcoin BounceThe rebound in bitcoin I warned about last week has come to fruition. Yet despite its recovery above the 200-day EMA, I remain bearish on the higher timeframes. Looking at bitcoin futures, I explain why I think bears are lurking above and may be happy to fade into rallies towards 120k.
Matt Simpson, Market Analyst at City Index and Forex.com

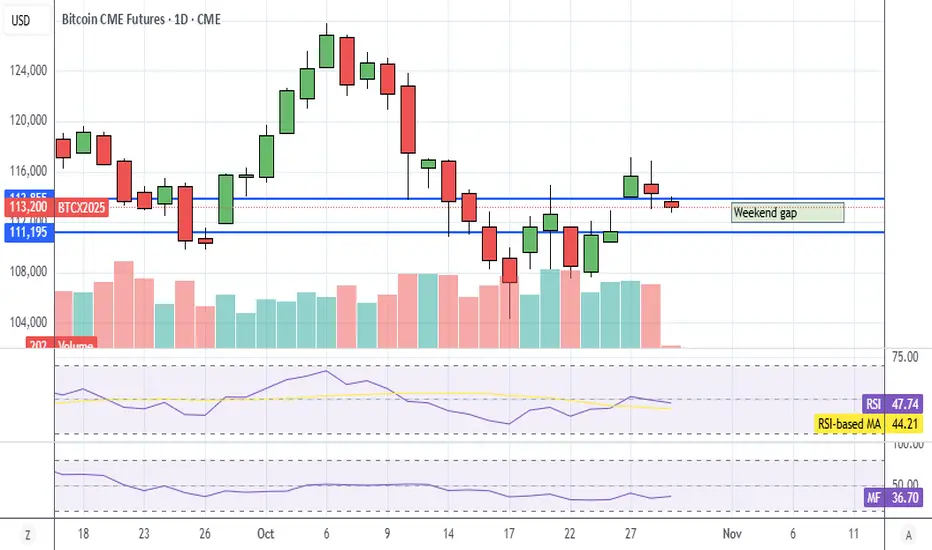
BTC Weekend Gap FillApparently futures don't like big crypto gaps, futures gaps tend to fill.
Algos punishing crypto for pumping on a weekend, which caused a big gap on Sunday open. I was kinda surprised BTC went up on Sat and Sun.
Anyways, too late to trade it now, but for future reference.
BTC CME CHART INDICATES A BEARISH NOVEMBER GOING BELOW 100K BTC has two bullish CME gap unfilled, very possible the banks and governments want to liquidated traders, but the only way to the bulls below the market has to go the market will have to go back below 100K,The easy algo and other technicals indicate the the market may push to the the all time high and creates and new or push south to 93k or 86K before it goes to the projected 132K

As promised Well , well , well i don't think I need to explain any further if you check my past posts you get the idea.
Lets see how its gonna play out this week
The gap and the fundamental news
Stay focused
Stay sharp.

Bitcoin Update - Stay range bound or breakdown
In this video I briefly recap on the expected swing failure at the lows and how we stayed rangebound since .
Although now we are back at the range lows I look at what might be ahead of us, do we break down this time or hold and push back inside .

Bitcoin Testing the $115K Level: What Traders Need to KnowBitcoin has been forming a complex trading range. Over the past three months, selling has improved. However, some short-term demand has appeared. The test of the $115K level will be key in revealing the quality of this latest buying.
After the deterioration by selling, there has been some preferred action. The question now is how the price comes to certain levels.
It all started with a specific bar that had some ease of movement over one, two periods. This led to improvement by selling, which was seen over the previous swing down. Off the top, there is again improvement in selling. This improvement is with limited result.
If price stays above a certain level, the question becomes: could we come back to specific levels? At this point, the market is retesting something.
The behavior at these levels will be important in determining the next move for Bitcoin and whether the quality of recent buying can hold up at the $115K test.

Bitcoin Futures ChannelBitcoin Futures Chart
- We have been respecting this channel all bull run and have once again bounced of thes support lines
- I think we have one more run up to the next upper line, or the one after that before the bull run tops
- The bull run will be over when we break the lowest trendline

Leverage is a Double-edged SwordCME: Micro Bitcoin Futures ( CME:MBT1! )
On October 6th, Bitcoin spot price hit a new all-time-high record at $126,198.07. The King of Crypto seemed unstoppable. Just four days later, President Trump escalated trade tension with China by threatening 100% additional tariff. This sparked a broad market selloff. The crypto market was among the hardest hits. Bitcoin plunged 11% for the day.
A post on X by The Kobeissi Letter captured the latest crypto crash:
"It's official: Crypto just saw its LARGEST liquidation event in history with 1.6 MILLION traders liquidated. Over $19 BILLION worth of leveraged crypto positions were liquidated in 24 hours, 9 TIMES the previous record." It notes it marked a single-day swing in Bitcoin's market cap of a $380 billion.
Leverage: A Double-Edged Sword
Leverage allows investors to amplify returns by borrowing funds, but it also magnifies losses, as seen in this crash. In crypto, traders often use 10x, 50x, or even 100x leverage, controlling large positions with very minimal capital. It was this overexposure, fueled by excessive leverage, that led to the $19 billion liquidation.
Margin trading can boost gains, but risks margin calls if prices suddenly drop, forcing asset sales at a loss. The risks of leverage are stark: a mere 2% price drop on a 50x leveraged BTC position wipes out 100% of the initial investment. Volatility, already high in crypto, makes leverage treacherous. A sudden drop of 5%, very common in cryptos, will overblow a $100K investment into negative balance of $150K for the same account.
While there are no regulatory limits in the U.S. restrict retail crypto leverage, few exchanges offer it. On the other hand, offshore crypto trading platforms offer much higher ratios, increasing exposure. Without stop-loss orders or risk management, leverage can turn a manageable dip into a total loss. Some crypto platforms offer Derivatives contracts. The name is often misleading. Many so-called “Exchanges” are not registered nor regulated by financial regulatory authorities. These contracts do not have the financial safeguard in place to protect the investors.
Investing in bitcoin is like riding a roller coaster. Taking on high leverage will be like not wearing a seatbelt. You could get thrown out of the ride every time it takes a turn.
Protecting your Bitcoin with CME Futures
As of October 18th, Bitcoin is up nearly 12% year-to-date. However, the gain was 32% when Bitcoin hit ATH. In less than two weeks, we have witnessed an 18% drawdown.
Despite the crash, Bitcoin’s long-term potential remains high. Its fixed supply of 21-million-coin and growing institutional adoption through exchange-traded funds and corporate treasuries support its "digital gold" narrative. Traders who are bullish on bitcoin could explore CME Micro Bitcoin Futures ( PSE:MBT ).
The MBT contract has a notional value of 0.10 bitcoin, as defined by the CME CF Bitcoin Reference Rate (BRR). On October 18th, the December contract (MBTZ5) is quoted at $108,495. Each contract has a notional value of $10,850. To buy or sell one contract, CME Group requires an initial margin of $2,590. By design, this futures contract has a built-in leverage of 4.2-to-1. When bitcoin goes up, futures positions could enhance the return by four times compared to spot bitcoin positions.
What happens if bitcoin drops? For price protection, traders could enter a buy order with a stoploss. For example, a long order at 108,495 with a stoploss of 100,000 limit the maximum loss to $849.5 (= (108495-100000) x 0.1).
In addition to margin (leverage) and stoploss (loss protection), Micro Bitcoin has a daily price limit at 10%. This feature is particularly helpful when the market is panicky. Price Limit or Circuit slows down the irrational price movements until cooler heads prevail.
To recap:
1) Always invest in Exchanges regulated by a national financial regulatory authority.
2) Employing bitcoin futures and options could enhance investment return.
3) Use stop loss to set maximum loss at a level within your tolerance.
Happy Trading.
Disclaimers
*Trade ideas cited above are for illustration only, as an integral part of a case study to demonstrate the fundamental concepts in risk management under the market scenarios being discussed. They shall not be construed as investment recommendations or advice. Nor are they used to promote any specific products, or services.
CME Real-time Market Data help identify trading set-ups and express my market views. If you have futures in your trading portfolio, you can check out on CME Group data plans available that suit your trading needs www.tradingview.com

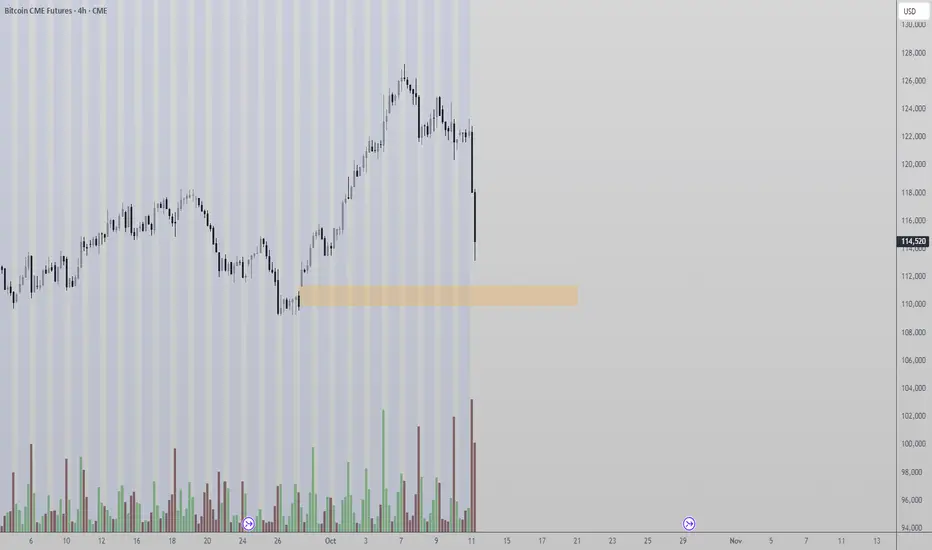
Bitcoin BTC Bias - enroute to 115kBitcoin may be in route to 115k this week? This is just the Bias now that price is between 110K and 115k? We are looking for healthy pullbacks on the way. Will BTC use 110k as support for the ascent?

Gap is filled , we can move onThe gap got filled ladies and gentlemen for those who opened short , congratulations
For those who didn't, well done staying out.
Remember the point isn't to gain capital but to preserve it.
Stay focused
Stay sharp
.
Sina

Technical Analysis – Bitcoin CME Futures (BTC1!)Technical Analysis – Bitcoin CME Futures (BTC1!)
Date: October 27, 2025 | Timeframe: Weekly | Exchange: CME Group
1. Trend Overview and Price Structure
Bitcoin CME Futures are trading at $115,090, up +3.69% for the week.
After nearly six months of consolidation between $100,000–$115,000, the current setup indicates an ascending triangle formation nearing completion — signaling a potential major breakout toward the end of Q4 2025.
The medium-to-long-term trend remains firmly bullish, supported by a strong accumulation base following the uptrend from the $38,000 low (June 2023).
Technical upside targets after a confirmed breakout: $127,300 → $141,800 → $156,700.
2. Key Technical Price Levels
Resistance: 127,300 – 141,800 – 156,700
Support: 113,500 – 105,000 – 95,800
3. Detailed Technical Analysis
(1) Short-Term Trend
The third bull-flag pattern since 2023 is developing. Bitcoin has closed above its 20-week EMA for 11 consecutive weeks, confirming structural bullish momentum. Short-term bias: Uptrend continuation, targeting $127,300 over the next 3–5 weeks.
(2) Volume Analysis
CME trading volume rose 22% versus the 4-week average. Institutional positioning (COT Report) shows net long positions up by 8,500 contracts — the highest level since March 2024.
(3) Elliott Wave Structure
Wave 1: 38,000 → 77,500
Wave 2: Correction to 63,000
Wave 3: Expansion to 118,000
Wave 4: Sideways consolidation (100,000–115,000)
Wave 5: Target zone 140,000–156,000
(4) Momentum Confirmation
RS vs S&P 500 continues to strengthen. MVRV Z-score: +1.95 — still below overbought territory, allowing an additional 25–30% upside.
4. VNC– Strategic Commentary
Market Context
The Bitcoin market is underpinned by three structural drivers:
- Strong ETF Inflows: According to Bloomberg ETF Flow (Oct 24), spot Bitcoin ETFs saw $2.8 billion in net inflows over 10 days, the highest since their early 2024 launch.
- Monetary Easing by the Fed: The Federal Reserve has hinted at a 0.25% rate cut in December 2025, reigniting risk-on sentiment in digital assets.
- Tight Supply Dynamics: Post-2024 Halving, block issuance fell 8%, while whale cold storage activity hit a 14-month high (Glassnode, Oct 25).
- Key Market Developments (Oct 12–27, 2025): - CME Group (Oct 25): Bitcoin futures open interest hit $7.42B, up 9% WoW. Bloomberg (Oct 23): Fed expected to cut rates in December; crypto assets responded positively. CoinDesk (Oct 22): Exchange stablecoin ratios rose 10%, signaling incoming liquidity. Glassnode (Oct 20): Wallets holding over 10,000 BTC increased 3.4%, showing institutional accumulation. Reuters (Oct 19): Tech investment funds are reallocating 16% of new risk-on capital back into crypto.
VNC Intelligence Assessment (BI View)
Short-Term (2–3 weeks): Sideways range $112,000–$127,000, awaiting breakout confirmation.
Medium-Term (4–8 weeks): Upside target $141,800, driven by sustained ETF inflows.
Risks: Short-term USD rebound or ETF outflows if the Fed delays rate cuts.
5. Suggested Technical Strategies
Bullish Scenario (Preferred):
Entry: 113,500 – 115,000
Targets: TP1 127,300 | TP2 141,800 | TP3 156,700
Stop-Loss: 107,000
Probability: 80%
Rationale: Ascending triangle breakout supported by ETF inflows and institutional accumulation.
Bearish Counter-Scenario (Short-Term Profit Taking):
Entry: 156,000 – 157,000 (upon hitting projected wave 5 top)
Target: 141,800
Stop-Loss: 160,000
Probability: 20%
Rationale: Short-term profit-taking at Fibonacci extension resistance.
VNC Intelligence Summary: Bitcoin remains in a strong macro uptrend, supported by robust institutional participation and easing macroeconomic conditions.The ascending triangle pattern signals a potential mid-Q4 breakout, with ETF inflows acting as the key catalyst for price acceleration toward $140,000–$150,000.

btc at 153k per coin within 5 months btc at 153k per coin within 5 months, 3-4 more cuts within 10 months, bull market. altseason for small and mid cap crypto
Chart Pattern Analysis Of BTC.
K6 and K7 verified a fake up candle of K5,
The market here turned to be more neutral.
If K8 keep expanding down to close below the neckline and the uptrend line,
The three years bull market will be terminated here.
If not,
The market will consolidate around 108K area for more weeks.
Considered K7 still failed to close below the uptrend line,
And K7 is weak than K5,
I am expecting a weak rebound around the neck line.
I will try to buy MSTZ to short it if my expectations verified by K8.

BTC FUTURES. CRYPTO PRIDE GOES 'COALESCE' INTO SOMETHING BIGGER BTC faces negative fundamental and technical perspectives due to escalating US-China tensions, which have sharply dampened investor sentiment and triggered risk-off behavior across global markets.
Fundamentally, renewed hostilities between the world's two largest economies - including tariff threats from President Trump and Chinese retaliation - have caused investors to withdraw from risk assets like Bitcoin, preferring safety and liquidity.
This has led to billions in ETF outflows and widespread selling pressure, undermining BTC's safe-haven narrative and reinforcing its correlation with traditional market stress.
Technically, BTC has broken key support levels, dropping below $112,000-$111,200 and failing to sustain its recent rebounds. The weakening price structure is marked by lower highs and persistent downward momentum, with liquidation of leveraged positions exacerbating volatility.
Market indicators, such as declining funding rates and falling perpetual markets, signal cautious investor behavior and further downside risks.
Retail and institutional withdrawal, coupled with geopolitical uncertainty, raise the likelihood of more pronounced corrections, with some analysts warning of a potential sub-$100,000 move if tensions intensify further.
In short, BTC Futures goes to break 6-month long recovery uptrend (came from mid-April crater), that gives a resonable opportunity to further decline.
--
Best wishes,
@PandorraResearch Team

Bitcoin Bulls Eye Bounce, Though Bears Could Be Lurking AboveUsing correlations with Wall Street indices, I outline why I think Bitcoin could be in for a bounce - though its rally could be limited before new lows are seen.
Matt Simpson, Market Analyst at City Index and Forex.com

Crypto Futures Trading LowerVolatility has been a main talking point over the last few days looking at many markets across different asset classes, and that volatility has stayed present in the Crypto futures markets starting off this week. Bitcoin futures have seen a steady increase in price since the lows in April and were able to climb to a new all time high price at the beginning of the month over $127,000. Since hitting that price, the market has been driven lower through previously significant levels and is trading lower today by about 3.7%. This downtrend is not just for Bitcoin futures, but also Ether, XRP, and Solana futures as well.
Looking at the other Crypto futures outside of Bitcoin, XRP has had the most dramatic selling pressure of the 4 products and is now trading right near the level it was trading at when the futures contract was launched after selling off 7% on the day today. Ether futures are also trading lower by over 6% on the day today after reaching a new all time high price back in August. These products often see significant volatility and the momentum has seemed to have shifted to the downside, and traders will be looking for a catalyst to send prices back higher before the end of the year.
*CME Group futures are not suitable for all investors and involve the risk of loss. Copyright © 2023 CME Group Inc.
**All examples in this report are hypothetical interpretations of situations and are used for explanation purposes only. The views in this report reflect solely those of the author and not necessarily those of CME Group or its affiliated institutions. This report and the information herein should not be considered investment advice or the results of actual market experience.

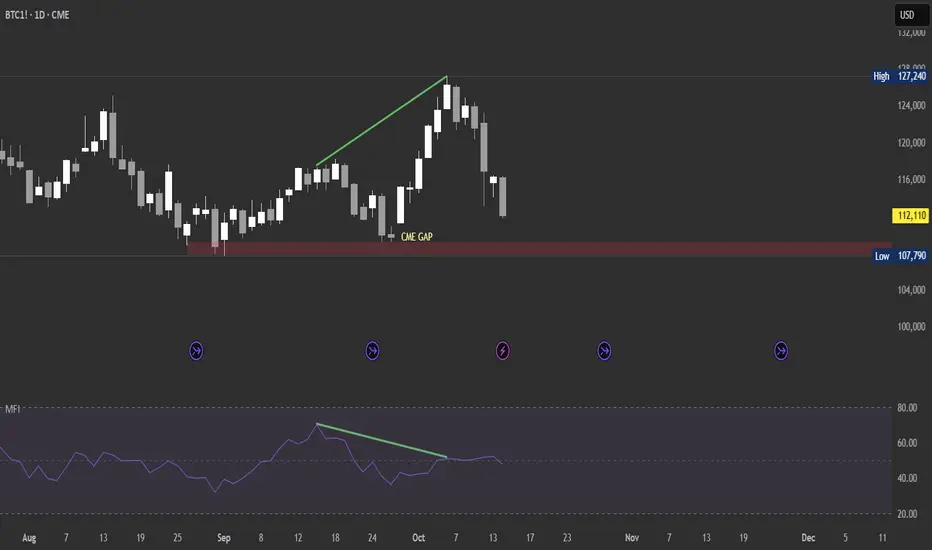
BTC heading to fill the CME GAPBTC looks like it's heading to fill the CME gap on the daily timeframe. That red zone could act as a strong support and a good level to go long under ideal conditions — unless our orange head decides to rig it again. Peace
Trader vs Gambler: Why Trading Isn’t GamblingThe Trader vs The Gambler: Why Trading Isn’t Gambling
“Trading is gambling.”
You’ve probably heard it before — from friends, family, or strangers who’ve seen a few flashy headlines, red charts, and crypto hype videos and decided: “It’s all luck.”
To most outsiders, the markets look like chaos — numbers flashing, candles flying, influencers shouting “BUY!” and “SELL!” as emotions run high.
It’s understandable that they think it’s all random chance.
But here’s the truth:
Trading can look like gambling when it’s done like gambling.
When done properly — with education, discipline, and structured risk — trading is a profession built on probability, process, and data.
What Trading Actually Is
Trading is the art and science of buying and selling assets — currencies, commodities, crypto, or stocks — to profit from price movements.
But unlike gambling, trading involves skill, timing, and measurable probabilities.
Professional traders don’t rely on hope — they rely on edges.
An edge is a repeatable setup or condition that statistically produces profits over time.
A real trader studies and uses:
- Price Action & Market Structure: Recognizing higher highs, liquidity zones, supply and demand, and where big players enter or exit.
- Technical Analysis : Tools like moving averages, Fibonacci retracements, volume profiles, VWAP, trendlines, and fair value gaps.
- Fundamental Analysis: Macro data, interest rates, inflation, earnings, tokenomics, project development, and regulatory events.
- Sentiment & Flow: Gauging crowd emotion, open interest, whale activity, and on-chain data.
- Risk Management: Strict position sizing, stop-loss placement, and capital preservation.
- Statistics & Journaling: Tracking setups, win rates, risk-to-reward, and performance over hundreds of trades.
- Discipline & Emotional Control: The ability to not trade when conditions aren’t right.
A trader doesn’t ask, “Will it go up?”
They ask, “If it goes up, what’s my risk? What’s my probability? What’s my plan if I’m wrong?”
That’s not gambling — that’s probability management.
What Gambling Actually Is
Gambling is risking money on an uncertain outcome without any control, edge, or process.
You rely purely on luck — a spin of a wheel, a flip of a card, a random move in a market you don’t understand.
The outcome is fixed against you. In a casino, the house always wins.
A gambler thinks emotionally:
“I have a feeling it’ll go up.”
“My mate said this coin’s going to explode.”
“I’ll double my bet to win it back.”
No analysis. No backtesting. No data. No control.
Just hope — the same force that keeps casinos rich and players broke.
When someone dumps $10,000 into a random altcoin because they saw a tweet or meme, that’s not trading — that’s emotional speculation.
They’re not following a plan; they’re following a crowd.
The Trader’s Mindset vs The Gambler’s Mindset
TRADER:
- Decision Basis: > Data probabilities, confluences
- Goal: > Consistent Long-term growth
- Risk Control: > Defined, Limited, Pre-set
- Emotional State: > Patient, Detached, Focused
- Reaction to loss: > Reviews plan, learns, adjusts
- Education: Studies psychology, risk, analysis
- Funding approach: > Scales up, uses funded accounts
GAMBLER:
- Decision basis:> Emotion, impulse, hype
- Goal: > Quick jackpot
- Risk control: > Undefined, often all-in
- Emotional state: > Fearful, greedy, erratic
- Reaction to loss : > Doubles down or quits
- Education: > Follows noise & influencers
- Funding approach: > Risks personal savings recklessly
A gambler sees “one trade” as the make-or-break moment.
A trader sees “one trade” as part of a thousand trades that define their edge.
Example: The Math of a Trader vs a Gambler
Trader:
Win rate: 55%
Risk-to-reward: 1:2
Risking 1% per trade
After 100 trades, they’re up roughly +55R - 45R = +10R (10% growth).
Their plan, consistency, and edge made it possible.
Gambler:
Win rate: Random, maybe 45%.
Risk-to-reward: 1:1 or worse.
Risking 10–20% per “bet.”
After a handful of losses, they’re wiped out.
There’s no math, no longevity — just emotional chaos.
This is why traders survive, gamblers vanish.
Why Trading Is Not Gambling
1. Trading Has Positive Expected Value (EV)
Gamblers play games with negative EV — odds mathematically stacked against them.
Traders create systems with positive EV by identifying patterns that statistically outperform random chance.
Example:
If your setup wins 55% of the time and earns twice what it risks, your long-term outcome will always be positive.
That’s not luck — that’s math.
2. Trading Has Risk Management
In gambling, you can lose everything on one hand.
In trading, you risk a small percentage per trade.
Professionals risk 0.5–2% of their account per setup.
That’s why they can lose 10 trades in a row and still be in the game.
Gamblers can’t — they blow up because they never manage risk.
3. Trading Uses Control and Data
You can’t “analyze” a roulette spin. You can’t manage risk at a blackjack table.
But in trading, you can backtest, strategize, and control your exposure.
Markets may be uncertain, but traders control their actions within that uncertainty.
Gambling has no such control — it’s fixed odds, rigged in favor of the house.
4. Trading Rewards Skill and Experience
The more you study, journal, and refine your process, the better you get.
No amount of practice makes you better at roulette — the wheel doesn’t care.
But trading rewards time, reflection, and discipline.
Skill matters. Patience matters. Data matters.
5. Trading Has Funding Opportunities
No casino will give you $50,000 to “gamble responsibly.”
But trading firms will give you a $50K, $100K, or $200K funded account — if you prove consistency and discipline.
Funded trading isn’t luck; it’s a business.
You’re rewarded not for profits alone, but for following rules:
- Max daily drawdown
- Overall drawdown limits
- Minimum trading days
- Profit targets
That’s structure — something gambling never has.
Why Use a Funded Account Instead of Your Own $50K?
Because professional trading is not about flexing capital — it’s about proving control.
Funded accounts are training grounds for serious traders:
- You trade with someone else’s capital.
- You’re held accountable to strict limits.
- You’re paid for consistency, not luck.
That’s professionalism.
Gambling is the opposite — no structure, no accountability, and no risk control.
A gambler risks $50K of their own money and hopes for a jackpot.
A trader risks 0.5% of a $50K funded account with a defined plan.
One burns out in a week.
The other builds a track record and earns a living.
The Reality Check: When Trading Does Become Gambling
Trading becomes gambling when:
- You trade without a plan.
- You follow hype or influencers blindly.
- You over-leverage.
- You revenge-trade.
- You skip journaling and analysis.
- You ignore stop losses.
The activity isn’t gambling — the mindset is.
A professional can take the same tool a gambler uses — the same chart, same exchange, same coin — and produce consistent returns, because their intent, process, and control are different.
Real-World Example
Two people open Bitcoin trades at $60,000.
- Trader A: Risks 1%, sets stop at $59,000, target $62,000. Reviews structure, confluences, and volume.
- Trader B: Risks 100% of his savings because “it’ll go up for sure.”
Same entry, same price.
One plays a game of probability, the other a game of hope.
One grows, one disappears.
The chart doesn’t decide who wins — their mindset does.
The Trader’s Mindset
A real trader thinks like a scientist:
- Hypothesis: If price rejects support and volume confirms, it may move up .
- Experiment: Enters small, stops defined.
- Result: Win or loss logged.
- Iteration: Reviews data, improves setup.
Gamblers don’t have hypotheses — they have feelings.
The trader’s mindset is structured:
- Plan before execution.
- Accept losses as data.
- Control risk religiously.
- Focus on consistency over excitement.
Detach emotionally from outcomes.
That’s why traders survive long-term while gamblers chase short-term highs.
“But Crypto Is Just Gambling!”
Crypto can look like gambling — because most people in it treat it like one.
They buy hype, ignore fundamentals, and chase every new shiny coin.
That’s not trading.
Real crypto traders:
- Study tokenomics, development teams, and market sentiment.
- Use technical levels and liquidity maps.
- Manage position sizes and hedge exposure.
- Treat it like a business, not a casino.
The asset class doesn’t make it gambling — your approach does.
Final Thoughts
Yes — both trading and gambling involve risk.
But risk ≠ gambling.
Risk, when managed correctly, equals opportunity .
The difference is control, process, and purpose.
A trader plays the long game with discipline and math.
A gambler plays for emotion and chance.
Anyone can click Buy.
But not everyone can manage risk, follow process, and think in probabilities.
So next time someone says:
“Trading is gambling.”
Show them this:
🎲 Gambling is random.
📊 Trading is calculated.
One depends on luck .
The other depends on discipline .
Thank you all so very much for reading this article, I enjoyed creating it and I hope it becomes of use too you.
If you have any requests on strategies, articles or would like charting done, drop a comment below.
Bitcoin CME Futures Gap Signals Potential Reversal ZoneBitcoin CME Futures have drawn traders’ attention as price action hovers around a critical gap zone. Historically, these gaps tend to act as magnets for price, often leading to retracements or reversals once filled. The recent move to $102K and subsequent rebound toward $112K marks a key technical event to monitor closely.
From a technical standpoint, the current open CME gap beneath the price is an area of high probability interest. These gaps typically get filled before a new directional trend resumes, making this region crucial for traders assessing the next major move.
Key Points:
- CME Gap at $102K Region: This gap remains a magnet for price action and could determine the next short-term direction.
- Price Reaction: The bounce from $102K to $112K suggests early signs of accumulation after the fill attempt.
- Historical Pattern: Bitcoin has a strong track record of filling CME gaps before resuming its broader trend.
As price stabilizes above $102K, traders should watch for confirmation candles and volume inflow signaling whether the reversal is sustainable or if another leg lower will test the gap’s depth.
Dont get trapped chasing the Opening gap Bitcoin Hello and Welcome
Here I present to you a quick theory on the Bitcoin CME open in the event we gap down and open in the 112K range.
This idea is just something to consider in the week ahead, with many traders destroyed as a result of Fridays crash and emotions running high going into the week ahead I encourage you to take a listen to this potential scenario for the week ahead on BTC.

BTC rally PeriodAS you see,btc follows circles from start to the end of rally.It may be look impossible but chart says so. Let's see in future.

A simple Introduction to Footprint charts
Welcome to this educational video on footprint charts .
I decided to do this introduction because I feel it would benefit so many traders who are unfamiliar with this chart type and once understood it can serve as a very powerful additional confluence in your day to day trading .
I hope I have delivered this lesson in a simple and understandable format for you too
understand the following .
The problem with just watching the price
What is order flow
Delta explained
What is open interest
How to tie it all together to produce better entries , exists and oversight into knowing when to take your trades.
I welcome any feedback or questions and I really hope that this serves you well.
*The link to the Tradingview guide is in the designated box on the right hand side I encourage everybody to use this resource .
