The Truth About Timeframe Analysis (No One Wants to Tell You)*You’re not confused because the market is chaotic.
You’re confused because your framework is garbage.*
🔥 Timeframes Don’t Lie — But Traders Do
Let’s be real:
You jump between timeframes looking for “confirmation,”
but all you’re really doing is collecting excuses.
1H looks bullish
15M looks like a breakout
4H is pulling back
5M is breaking structure in the opposite direction
Now you have five different opinions in your head
and exactly zero conviction.
You hesitate.
You enter late.
You get trapped.
You flip bias like a rookie.
This isn’t “market randomness.”
It’s simply a lack of hierarchy.
⚡ The Market Isn’t Messy. YOUR PROCESS Is Messy.
Every timeframe gives you a “mini truth.”
Without structure, you mix them together into something that feels like analysis…
but is actually noise dressed as logic.
That’s why you keep:
❌ trading micro signals against macro structure
❌ believing every candle is a reversal
❌ ignoring invalidations because you “like the setup”
❌ frying your brain before you’ve even risked a dollar
You don’t need another indicator.
You need a logic system that crushes noise and exposes REAL probabilities.
🔥 The 3 Variables (The Part Traders Think They Understand… But Don’t)
Most traders “kind of” know what trend, zones, and candles are.
And “kind of” is exactly why they lose.
In this model, each variable has a precise definition, variations, and probability weights that change depending on the context.
You’re not reacting emotionally — you’re measuring.
That’s what makes the system mechanical.
1️⃣ Trend — The Market’s Actual Intent (Not Your Guess)
Definition:
The structural direction defined by higher timeframes — not the last 3 candles on 5M.
Variations:
Strong trend
Weak/aging trend
Neutral compression
Context impact:
A strong trend entering a strong zone with a confirming candle = high probability.
A tired trend hitting a counter zone = danger.
👉 Trend isn’t “up or down.”
It’s how mature and healthy that direction is.
2️⃣ Zone — Where the Real Decisions Are Made
Definition:
Price areas that actually matter: supply, demand, break/retests, major SR.
Variations:
Fresh zone (strongest)
Retested zone (usable)
Overused zone (dead)
Context impact:
Zones inside dominant trend → continuation setups
Zones against dominant trend → only valid with strong multi-timeframe alignment
Zones broken on mid-timeframes → bias must be re-evaluated
👉 Zones aren’t lines.
They’re probability clusters.
3️⃣ Candle — The Signal That Confirms… or Invalidates Everything
Definition:
The micro-expression of intent: rejection, displacement, absorption, continuation.
Variations:
Rejection wick
Displacement/imbalance
Compression
Fake strength traps
Context impact:
A “strong candle” in a weak zone means NOTHING.
A clean rejection + structure shift inside a strong zone + aligned trend = top-tier entry.
👉 Candles are not signals by themselves.
They’re filters.
💥 The Edge Isn’t the Variables — It’s Their Alignment
Anyone can draw zones and identify candles.
Losing traders do it every day.
The real edge comes from understanding:
how each variable shifts with context
how its probability weight changes
how alignment creates high-probability setups
how misalignment warns you to STOP IMMEDIATELY
Once each variable has a precise meaning
and precise behavior inside each context…
The system becomes mechanical.
No more emotional gambling.
No more “I think this is a reversal.”
No more overthinking.
Just one rule:
If the variables align → execute.
If they don’t → wait.
📶 The Only Timeframe Hierarchy That Makes Sense
📌 High Timeframes (4H / 1H)
→ Define true market bias
→ Only overridden by strong opposite confluence
📌 Mid Timeframes (30M / 15M)
→ Confirm or challenge the bias
→ Can create valid setups if rules align
📌 Entry Timeframes (10M / 5M / 2M)
→ Execution only
→ No bias allowed here
This structure kills FOMO, kills hesitation, and kills the “I changed my mind” syndrome.
🚀 The Two Setups That Actually Pay
1️⃣ Precision Setups (Low-Risk / High-Accuracy)
1:1 to 1:2
Clean, frequent, reliable.
2️⃣ Momentum Setups (When Everything Aligns)
1:3+
Rare — but violent and highly profitable.
If you’ve ever seen the market move exactly as you forecasted…
That was confluence.
You just didn’t know how to replicate it.
💀 Stop Trading Noise. Start Trading Probability.
This model does NOT eliminate all losses.
It eliminates the avoidable, stupid ones caused by emotional reactions and inconsistent bias.
Give me 10 trades executed under true confluence,
and the results explain everything.
📣 Want Chapter 2?
I’ll break down the full confluence model and the exact rules that make it repeatable.
Follow me here on TradingView,
save this idea,
and comment “CH2” if you want the next release.
More coming soon —
but only for the people actually paying attention.
Trade ideas

From Shutdown Relief to AI Anxiety — Two Narratives Driving ESMarket Theme
The week began on a strong footing, driven by a bullish Sunday reopen in ES after news broke that the 43-day government shutdown was set to end, following the Senate’s late-night support for a potential agreement on November 9th. This relief catalyst created early upside momentum, pushing the index toward all-time highs (ATHs).
However, the tone shifted mid-week. The rally lost steam as markets refocused on a growing concern: the sustainability of current Tech and AI valuations. Investors are becoming more sensitive to the possibility of overstretched AI-related capital expenditure and an emerging bubble narrative, especially with heavyweight earnings and forward-guidance looming. This led to a rotation out of high-beta tech and into safer or less-extended sectors.
On the macro front, Fed speakers adopted a more cautious—if not outright hawkish—tone, emphasizing that a December rate cut is far from assured. The recent government shutdown created a backlog in key economic data releases, leaving policymakers and traders alike without clear visibility into the true state of the economy. The lack of data has amplified uncertainty and reduced the market’s conviction around the timing of any potential policy easing.
In short:
The market is caught between two opposing forces:
The optimistic narrative (shutdown resolved, path to ATHs, resilience in U.S. growth), and
The risk narrative (valuation excess, policy uncertainty, narrowing breadth).
This push-pull dynamic has resulted in compression rather than continuation, with a heavy focus on clarity from upcoming data and major earnings.
What is the Market Doing?
Last week formed an inside week, with the entire range trading within the prior week’s range and settling close to the previous week’s close. This signals indecision and balance, as neither buyers nor sellers had the conviction to push the market into expansion.
Current price action shows the market compressing between:
6875 — previous week’s VPOC / 27 Oct weekly VAL
6740— 13 Oct weekly VAH / 10 Nov weekly volume ledge
These levels are well-defined and respected. The upward trendline continues to hold, with multiple strong rejections signaling responsive buyers stepping in to bid prices back up.
The battle is now between buyers attempting to defend 6740 area which is also confluent with the daily trendline support, and sellers leaning on the overhead resistance close to 6875.
What to Expect in the Coming Week
The key line in the sand (LIS) this week:
→ 6755.25 — Previous week's settlement
Bullish Scenario
If 6755 holds as support, expect buyers to attempt a push toward:
6874.50 — previous week's VPOC
6905.5— weekly 1-SD volatility high
Anticipate responsive sellers in this area.
However, if price breaks above 6874.50 with pace and volume and accepts above it, the path opens for a retest of the ATHs as momentum players and trapped shorts fuel continuation.
Bearish Scenario
If the market accepts below 6755 and fails to reclaim it on any pullback:
First downside target: 6660 — 13 Oct weekly VAL
If buyers fail to respond there, expect an acceleration lower from long liquidation toward:
6605— weekly 1-SD volatility low
6504 — previous month's low (deeper target)
This scenario strengthens if the trendline breaks and sellers begin stepping down aggressively.
Neutral / Compression Scenario
If the market remains trapped between 6875 and 6740 with no breakout supported by pace and volume:
Expect two-way rotational trade
Continued compression and balance within the well-defined range
A buildup of energy that may resolve later in the week with data, earnings or fundamental catalysts
Conclusion
As we start the new week, ES remains tightly coiled between well-defined levels, with the market waiting for clarity from data, earnings, and policy signals. Whether we break from compression or continue to balance, the key will be how buyers and sellers respond around 6755 and whether there are new fundamental catalysts.
As always, I’d love to hear your view on the markets and ES this week? — Drop it below — and give it a boost so more of the community can join the conversation.
Glossary Index for all technical terms used:
VAH (Value Area High)
VAL (Value Area Low)
VPOC (Volume Point of Control)
SD (Standard Deviation)

ES UpdateQuite the pump on NVDA earnings especially considering the stock is up only 5% AH.
Appears the algos are on and pumping, so I expect to go overbought, but that depends on jobs report (Sept data) and Fed meeting minutes tomorrow.
I'm guessing we get a 3 day rally like the last pump (overlay is the early Nov pump), then the selloff resumes next Tuesday. There is a potential of a Thanksgiving holiday melt up though.
I think I'll wait until the Fed meeting minutes before deciding what to do. No positions, I dumped my GM calls this morning. Did not enter into any trades, because of NVDA, jobs report, and Fed minutes.

/ES1! Analysis towards openingJust purchased Trading View Premium today and I've been playing around some of the features they offered, when I realized looking at the cummulative delta that there is a divergence and passive sellers have been absorving throughout the friday session. I guess when they are done accumulating their short positions there will be another imbalances to a lower floor. Let's see what the gamma says at opening.

ES Supply-Demand Long TradeTook a small position on buying the ES 15-minute level of demand.
Technicals = bullish/ mixed depending on outlook
Fundamentals = bullish
Sentiment = mixed
FED/News will impact this event.

ES Gap AlertFutures are up but they all gapped up which means that has to fill, but you guys know that by now, lol. It is headed down right now.
Not sure what the pattern will be because market will be closed Thu and half day on Fri, and day after Thanksgiving is usually low volume trading.
We'll see what futures look like before open tomorrow.
Day 73 — Perfect Rejection at the 2-Hour MOB | S&P Futures TradiEnded the day +$529.40 trading S&P Futures. Today was a solid bounce back, with the morning analysis playing out almost perfectly. I managed to catch the top of the day and ride the momentum down right as we rejected the 2-hour MOB. It felt good to be in sync with the market structure, especially with the volatility leading up to the Nvidia earnings release. The signals were clean, the execution was sharp, and it was just one of those days where the plan came together.
🔑 Key Levels for Tomorrow
Above 6725 = Bullish Below 6710 = Bearish
📰 News Highlights
NVIDIA SHARES JUMP 5% AFTER 4Q REVENUE OUTLOOK TOPS ESTIMATE

Day 74 — Surviving a 242-Point Crash MoveEnded the day +$450.40 trading S&P Futures, but I’m walking away feeling tilted despite the profit. We sniped the 48-minute MOB resistance right out of the gate—just as planned in last night’s video—but I never expected the market to flush 242 points from top to bottom. That is a "market crash" level move. My P/L was a complete rollercoaster, swinging from +$400 to negative and back again. I’m grateful to end green, but after a session this volatile, I’m likely locking my account and taking a mental break tomorrow.
🔑 Key Levels for Tomorrow
Above 6725 = Bullish Below 6710 = Bearish
📰 News Highlights
BITCOIN FALLS 3% TO $87,000, LOWEST SINCE APRIL

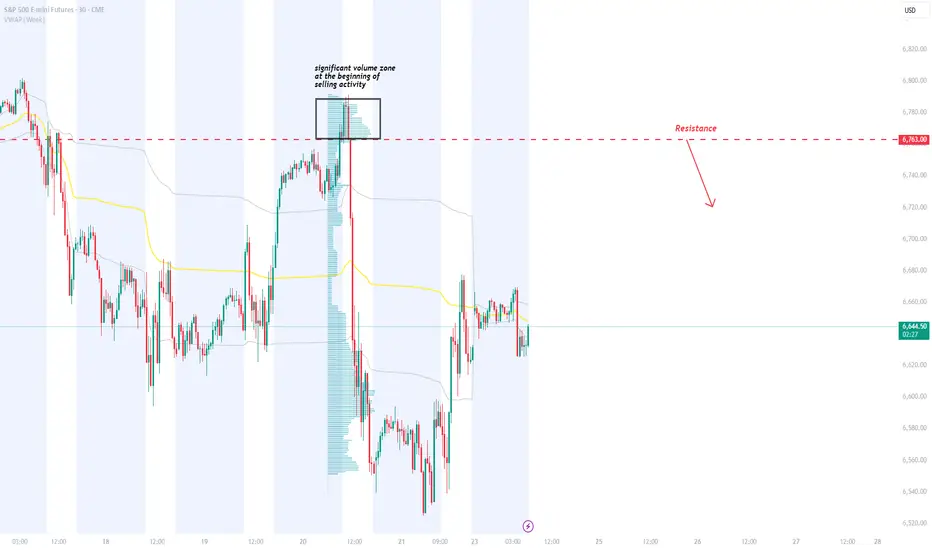
ES 6763: Heavy-Volume Resistance + FVG Confluence Short SetupPrice is approaching a strong resistance on ES at 6763. This level sits at the start of a heavy-volume zone created during a major selloff, where sellers built short positions and are likely to defend again. A bearish Fair Value Gap aligns with the same level, adding strong confluence. If price pulls back into 6763, the short setup becomes highly attractive.
ES (SPX, SPY) Week Ahead Analysis - (Nov 24th - 28th)Executive Overview
Equity markets, particularly the E-mini S&P 500 (ES), are currently navigating a broader weekly uptrend, yet have entered a phase of short-term correction after encountering resistance around the 6,900 to 7,000 level. Presently, prices hover near 6,660, finding support from a robust pocket in the mid-6,500s.
Recent volatility indices have surged, with the VIX now in the low 20s and the term structure exhibiting a near flat or slight backwardation. Meanwhile, key credit metrics, funding conditions, and spread behaviors remain stable, suggesting that the current market dynamics are more indicative of equity valuation adjustments and positioning realignments rather than a sign of systemic distress.
Looking ahead to the coming week, we anticipate a choppy trading environment characterized by two-sided price movements within a range of 6,520 to 6,780. Intraday strategies are likely to involve selling into strength around resistance levels R1 and R2, while seeking to capitalize on buying opportunities when prices approach support levels S1. Notably, the VIX is expected to remain elevated above its recent teens regime during this period.
A critical point of focus will be the 6,520 to 6,540 support zone. Should this area fail to hold on a daily closing basis, we could see the correction extend toward the 6,420 to 6,450 range, with further downside potential targeting the low-6,300s.
Multi-Timeframe Analysis of Market Structure
Weekly Trend: Premium/Discount
The current market structure remains characterized by higher highs (HH) and higher lows (HL). The last significant upward movement peaked just shy of 7,000, while the ongoing pullback has managed to hold above the previous weekly higher low band, located in the high-5,000s to low-6,000s range. A notable supply zone exists from approximately 6,850 to just above 7,000, identified as a weak high. Below this, a robust demand/value area spans from around 5,850 (at the 1.272 Fibonacci retracement) down to approximately 5,575 (the 2.0 Fibonacci level) from the previous major leg. On this timeframe, the E-mini S&P (ES) is trading at a premium in relation to the substantial 5,800–5,900 weekly value area. However, we have transitioned from momentum-driven expansion to a mean-reverting correction phase.
Daily Trend and Range
Shifting to a daily perspective, the structure has inverted to a short-term downtrend, marked by a lower high established near 6,900, followed by a lower swing low around the 6,520s. Fibonacci retracement levels from the last sell-off align as follows: 1.272 at approximately 6,521, 1.618 at around 6,418, and 2.0 at approximately 6,304. The 6,520s zone is precisely where price action found support. For the upcoming week, the operative daily range can be defined between 6,520–6,540 as the lower band and 6,760–6,780 as the upper band, coinciding with the previous breakdown area and recent four-hour lower high.
Four-Hour Structure
Analyzing the four-hour chart reveals a clear downward impulse from the mid-6,700s lower high to lows in the mid-6,500s, followed by a sharp rebound. A Fibonacci sequence applied to this movement suggests retracement levels of 1.272 at approximately 6,527, 1.618 at around 6,455, and 2.0 at roughly 6,376. These levels coincide with a notable demand block around the 6,520–6,540 range, identified as a "strong low," with additional liquidity found in the 6,450s and 6,370s. The recent upward movement from these lows appears corrective within the broader impulse, indicating a potential lower high is forming under the 6,680–6,700 area. Until price reclaims and maintains this band, the four-hour swing remains in a down-to-sideways trend.
Hourly Context
From an hourly viewpoint, the ES experienced a decline from approximately 6,770 to the mid-6,500s, subsequently establishing a series of higher lows as it grinds upward. Recent hourly activity shows price pressing against an overhead resistance zone located around 6,660–6,670, just beneath the Asia Session high of 6,662.5 and the New York PM high / previous day high at 6,677.5. The volume-weighted average price (VWAP) is situated near 6,609.75, with prior intraday lows clustering between 6,594 and 6,611.75. Intraday, the ES is currently mid-range, confined between support levels at 6,640–6,642 (Asia Session Low) and resistance at 6,662.5–6,677.5 (Asia Session High / New York PM High / Previous Day High / Yearly Value Area High).
Weekly and Daily Oscillators / Momentum
The weekly oscillator has retracted from overbought conditions but remains elevated, signifying a cool-off within a strong uptrend. Conversely, the daily oscillator is currently oversold and beginning to reverse, showing readings in the mid-20s with the first uptick following a significant downturn. This pattern is classic for potential bounces; however, confirmation of a full trend reversal is yet to materialize.
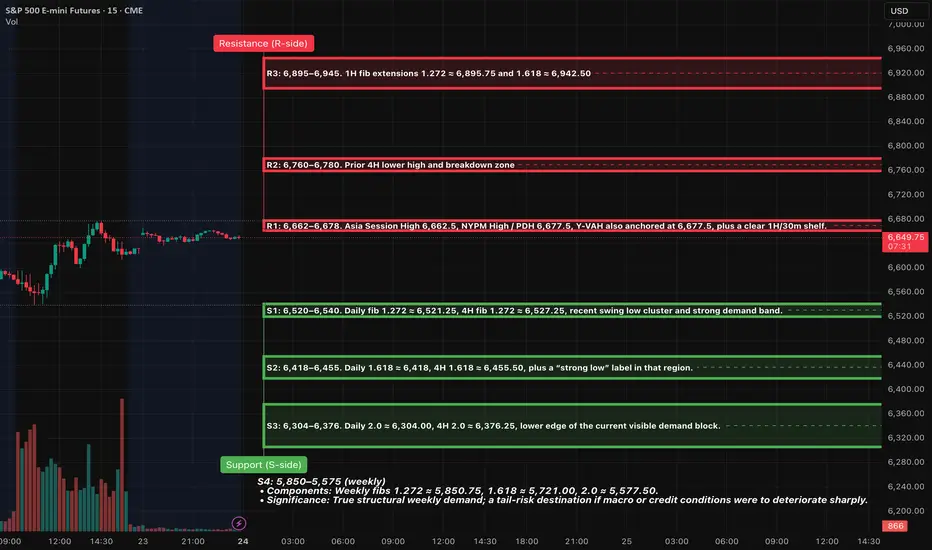
Key levels and zones
Resistance (R-side)
R1: 6,662–6,678
• Components: Asia Session High 6,662.5, NYPM High / PDH 6,677.5, Y-VAH also anchored at 6,677.5, plus a clear 1H/30m shelf.
• Significance: This is the nearest control ceiling; it capped Friday’s rebound and marks the boundary between neutral intraday and more aggressive squeeze potential.
• Role: First place to fade “pop-and-fail” wicks for short A++ plays, and the first area that must be decisively reclaimed for bulls to press a larger squeeze.
R2: 6,760–6,780
• Components: Prior 4H lower high and breakdown zone; 1H HH before the large red impulse bar; sits just below a dense daily supply band.
• Significance: A retest of broken support turned resistance. Acceptance back above here would suggest the entire recent flush was a failed breakdown, opening the path to retest the highs.
R3: 6,895–6,945
• Components: 1H fib extensions 1.272 ≈ 6,895.75 and 1.618 ≈ 6,942.50, plus prior weekly weak high / supply band just under 7,000.
• Significance: This is the larger-timeframe cap. Reaching this zone in one week would likely require either a decisively dovish Fed tone or very strong data.
---
Support (S-side)
S1: 6,520–6,540
• Components: Daily fib 1.272 ≈ 6,521.25, 4H fib 1.272 ≈ 6,527.25, recent swing low cluster and strong demand band.
• Significance: This is the primary weekly pivot for the current correction. First major A++ long location if it’s flushed and reclaimed during liquid hours.
S2: 6,418–6,455
• Components: Daily 1.618 ≈ 6,418, 4H 1.618 ≈ 6,455.50, plus a “strong low” label in that region.
• Significance: This is deeper discount inside the current swing, where larger timeframe players would be expected to defend aggressively if the broader uptrend is to remain intact.
S3: 6,304–6,376
• Components: Daily 2.0 ≈ 6,304.00, 4H 2.0 ≈ 6,376.25, lower edge of the current visible demand block.
• Significance: If price reaches here this week, the market is in a full-fledged risk-off extension, but still within the context of the broader weekly uptrend.
S4: 5,850–5,575 (weekly)
• Components: Weekly fibs 1.272 ≈ 5,850.75, 1.618 ≈ 5,721.00, 2.0 ≈ 5,577.50.
• Significance: True structural weekly demand; a tail-risk destination if macro or credit conditions were to deteriorate sharply.
---
Volatility Backdrop
The VIX spot closed at approximately 23.4 on Friday, having surged beyond 26 earlier in the week, marking the highest levels observed since spring. The VIX futures curve has shifted to a flat or mildly backwardated structure, with near-term contracts hovering around 22.9 for late November and extending into subsequent months. Meanwhile, rates volatility (MOVE) is situated near 78–79, close to its historical average, indicating it is not in crisis territory.
The volatility complex is signaling a notable expectation of an equity shock, although it does not reflect panic in the funding or rates sectors. The flat to slightly backwardated volatility curve suggests potential for larger intraday swings and gap risks, while also presenting significant reward opportunities when market entries align with critical price levels.
Options and Positioning
The total put/call ratio currently stands at approximately 0.87, with the index put/call ratio around 1.03, and exchange-traded products (ETP) at about 1.28. In contrast, the equity-only put/call ratio is at a lower 0.56. The 10-day moving average of the total put/call ratio is approximately 0.90, which is not indicative of panic extremes. The SKEW index is around 148—elevated, yet falling short of the extreme levels (150–160+) that typically signal substantial tail-risk hedging.
Institutional hedging remains present but lacks urgency; there is a distinct preference for put options in indices and ETFs, while single-stock options continue to skew toward calls. Coupled with a VIX in the low-20s and a near-flat curve, this indicates that dealers are likely moderately short gamma at current strike prices. Consequently, price movements beyond key levels may extend further than usual before reversion occurs. This inference, drawn from the volatility and put/call configurations, does not represent a direct measurement.
Market Breadth and Internals
Earlier in the week, the NYSE experienced a significant imbalance, with decliners outnumbering advancers by more than 3:1, alongside a higher count of new lows than new highs, a classic indicator of distribution. However, by Friday, the breadth reversed sharply, with approximately 2,237 advancers against 548 decliners on the NYSE. Nevertheless, the McClellan Oscillator remains negative (~-72), and the Summation Index is in a downward trajectory, suggesting ongoing repair rather than the emergence of a new bull trend. Defensive sectors, including health care and consumer staples, have outperformed, while tech and speculative AI stocks led the recent selloff.
The market has transitioned from a clear uptrend to a choppy corrective phase characterized by distribution. The activity on Friday, while indicative of an oversold breadth thrust, has not confirmed a market bottom.
Credit and Funding
The high-yield ETF (HYG) is trading around 80.3, only slightly below recent highs, indicating no signs of disorderly selling. The US high-yield option-adjusted spread (OAS) is near 3.17%, and B-rated high-yield OAS is about 3.3%, both well below long-term averages (>5%) and only marginally above recent tight levels.
Conclusion:
Credit markets display relative calm, reinforcing the notion that the recent weakness in equities is driven by valuation and sentiment rather than a funding crunch.
Sentiment and Crowd Positioning
Recent AAII survey results indicate roughly 32.6% of respondents identify as bulls, while 23.9% classify as bears. This results in a negative bull-bear spread of about -11%, contrasted with a long-run average of +6%. The combination of an elevated VIX, a negative bull-bear spread, and moderate put/call ratios reflects a climate of pessimism without full-fledged capitulation.
Practical Takeaway:
There exists potential for an upward squeeze if macroeconomic headlines shift towards dovish sentiment. However, a prolonged risk-off environment remains possible if critical support levels like S1 and S2 break.
Cross-Asset and Global Risk Tone
Global equities experienced their most significant weekly pullback since early this year, with the MSCI World Index declining by roughly 3%. Europe’s Stoxx 600 recorded its largest weekly drop since summer, primarily driven by weakness in the tech sector and increased volatility. The cryptocurrency market is in a full risk-off stance, with Bitcoin dipping to a seven-month low before rebounding around $84k, accompanied by sentiment indicators reflecting extreme pessimism and heavy liquidations, now followed by a weekend bounce from oversold RSI levels.
Relative Risk Tone:
The Nasdaq-100 (NQ) remains weaker compared to the S&P 500 (ES), aligning with the decline in tech and AI sectors, while defensive and value-oriented sectors maintain resilience. Overall, the cross-asset narrative suggests a risk-off tone, yet not systemic in nature—exactly the backdrop where well-defined level trading is most effective.
Macro and Data Calendar
The upcoming holiday-shortened week is set to unveil a series of delayed U.S. economic data, including September retail sales, PPI, Core PPI, home prices, pending home sales, inventories, and consumer confidence on Tuesday, followed by jobless claims, durable goods, Chicago PMI, and the Beige Book on Wednesday. The prior government shutdown has postponed key GDP and inflation reports, heightening uncertainty around the Fed's December decisions. Federal Reserve officials exhibit divided opinions about another rate cut in December; some advocate for a pause with inflation near 3%, while others, including at least one governor and the NY Fed president, lean toward support for an additional 25 basis point reduction. Market odds for a December cut have shifted within a ~50–70% range, depending on daily fluctuations.
Classification of the Recent Move:
This market dynamic appears primarily as a reset in valuations and positioning following the exuberance surrounding AI and tech, exacerbated by data-related uncertainty rather than stemming from a definitive “data shock” event.
13. Two A++ setups (for the coming sessions)
These are plan-level plays, to be executed only if price action and vol conditions line up as described.
A++ Setup 1: R1 Rejection Short
Trigger
Inside NY AM or the first hour of NY PM:
1. 15m candle wicks above 6,670–6,675 and closes back under 6,665.
2. 5m prints a lower high beneath that wick, closing back below ~6,660.
3. 1m breaks down through the intraday shelf near 6,655 with increased selling volume / negative delta.
Execution
• Entry: around 6,660–6,665 on the first 1m pullback that fails under the broken shelf.
• Initial stop: above the wick high, e.g. 6,690 (adjust to the actual 15m high but keep risk in the 20–25 point range).
• Risk (example): entry 6,665, stop 6,690 → 25 pts.
Targets
• TP1: 6,615–6,620 (VWAP / prior intraday shelf) → about 2R (50 pts) from a 25-pt stop.
• TP2: 6,540–6,550 (upper edge of S1 / prior congestion) – roughly 4R.
• TP3 (runner): 6,520–6,530 (core of S1 cluster) – 5R+ if reached.
A++ Setup 2: S1 Flush-and-Reclaim Long
Trigger
15m candle flushes below 6,530, ideally tagging 6,520–6,525, with a long tail and closes back above ~6,535–6,540.
5m shows a higher low above the 15m wick low, with real bids stepping in and volume picking up.
1m pushes back through 6,545–6,550 and holds, turning that band into a floor.
Execution
• Entry: 6,545–6,550 on the first 1m pullback that holds above 6,540 after the reclaim.
• Initial stop: below the 15m flush low, e.g. 6,515–6,520.
• Example parameters: entry 6,550, stop 6,520 → 30-pt risk.
Targets
• TP1: 6,595–6,600 (local shelf / prior L at 6,594 and ONH/VWAP neighborhood) → about 2R (60 pts) from a 30-pt stop.
• TP2: 6,662–6,678 (R1 band) – the same ceiling from Setup 1; that’s roughly 4R+ from the entry.
• TP3 (runner): 6,760–6,780 (R2) if data and vol cooperate, giving 7R+ potential.
If that microstructure doesn’t show up, downgrade each play from A++ to stand-aside – let someone else fight in the middle of the range and keep your capital for when the levels truly light up.
Good Luck !!!
ES (SPX, SPY) Analysis, Levels, Setups for Tue (Nov 25th)Market Outlook: Analyzing Technical Trends and Economic Indicators
The recent rebound from the 6520–6450 support zone has generated a constructive short-term outlook. However, the market now approaches a significant supply area in the 6800 range. While the immediate trend appears to favor modest gains, contingent upon maintaining support between 6660 and 6645, a pivotal decision zone resides between 6765 and 6815. A strong acceptance above this band could trigger an upward movement towards 6855–6930, while failure to hold could lead to a corrective phase targeting 6690, 6625, and potentially 6550.
Upcoming Economic Data: November 25
The week ahead is marked by a wealth of economic data expected to impact trading activity, particularly in the U.S. housing market and consumer sentiment. Key reports scheduled for Tuesday morning include the S&P/Case-Shiller Home Price Index for September, the Conference Board Consumer Confidence Index for November, Pending Home Sales for October, and the Richmond Fed Manufacturing Index. These releases, set for the 9:00–10:00 ET window, could introduce volatility into the markets.
Recent trends in consumer confidence have suggested a dampened sentiment due to the prolonged government shutdown and slow job growth. A disappointing report could perpetuate discussions of recession and further Fed interest rate cuts, while an unexpected improvement would likely support the current risk-on sentiment.
On the corporate front, pre-market earnings from major players like Analog Devices, Alibaba, Best Buy, Dick’s Sporting Goods, J.M. Smucker, and NIO could further influence market dynamics in the early hours, especially if there are surprises in their guidance.
Technical Analysis: Higher-Timeframe Perspective
From a higher-timeframe standpoint, the daily chart reflects a completed down-swing exiting the prior weak high around 6930, retracting to the extension zone between 6525 and 6455 where buyers have demonstrated strong interest. This low now appears as a "strong low" in technical analysis terms, aligning with higher timeframe discount levels and previous demand signals. Oscillators indicate a shift from oversold conditions, currently suggesting a corrective rally rather than an immediate resumption of a downward trend.
However, trading remains constrained within a 4-hour supply band between approximately 6765 and 6815. This range is characterized by the last notable lower high and previous sell-side momentum that precipitated the significant drop to 6520. Unless price breaches the 6815 threshold, the overall swing structure continues to reflect a "lower-high" scenario, which necessitates caution for any bullish positions as they occur within a broader corrective framework.
Intraday Trading Dynamics: Expectations for the Day
Analyzing the intraday structure on the 1-hour and 30-minute charts reveals that Monday’s trading culminated in a robust upward trend from the London low of 6625 to the New York AM low of 6646, concluding with a consolidation phase just beneath the Asia session high at 6724. The cluster of highs around 6715–6725 precisely correlates with an intraday equilibrium line situated just below the upper edge of the 4-hour supply band.
Volume data indicates strong buying activity emerging from the base established at 6520–6625, tapering off as prices approached the 6715–6725 range. Further insights from the 1-hour oscillator hint at a cooling in momentum, suggesting that initial price reactions may favor mean reversion rather than an unimpeded breakout.
Looking ahead into the New York trading hours:
- Asia Session: Anticipate a trading range likely between 6700 and 6730, with potential stop raids above 6725 and minor retracements towards 6685.
- London Session: If buyers can sustain the 6685–6660 level during potential pullbacks, this could establish a foundation for another attempt at reaching the 6765–6815 supply zone during the New York data release.
- New York Open: Provided that the 6660–6645 area holds during 15-minute closes, the baseline scenario suggests a rotation into the 6765–6815 decision band between late London and early New York. A significant rejection in this zone, characterized by long upper wicks and unsuccessful 15-minute closes above 6815, would favor a pullback towards 6690–6710 by day’s end. Conversely, clear acceptance above 6815 on robust volume would pave the way for targets at 6855 and potentially back to 6930.
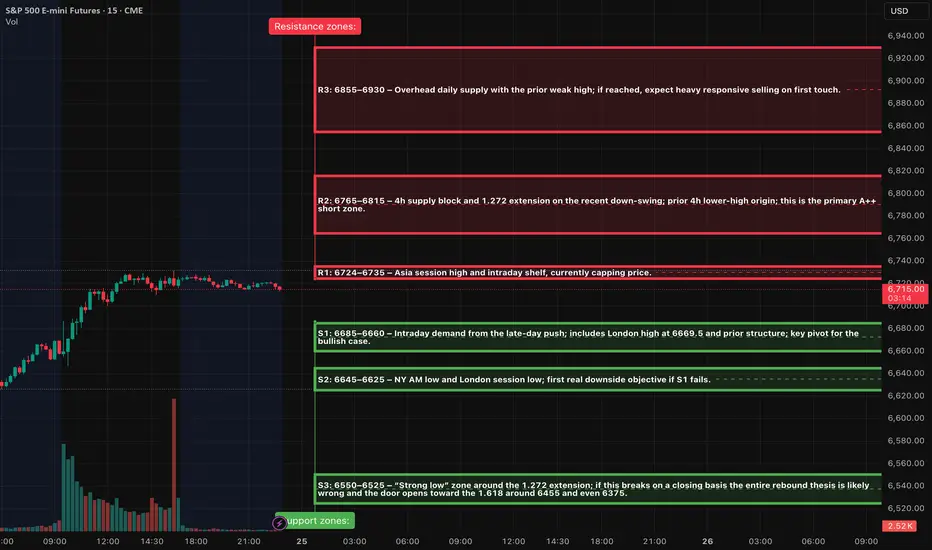
Key zones
Resistance zones:
R1: 6724–6735 – Asia session high and intraday shelf, currently capping price.
R2: 6765–6815 – 4h supply block and 1.272 extension on the recent down-swing; prior 4h lower-high origin; this is the primary A++ short zone.
R3: 6855–6930 – Overhead daily supply with the prior weak high; if reached, expect heavy responsive selling on first touch.
Support zones:
S1: 6685–6660 – Intraday demand from the late-day push; includes London high at 6669.5 and prior structure; key pivot for the bullish case.
S2: 6645–6625 – NY AM low and London session low; first real downside objective if S1 fails.
S3: 6550–6525 – “Strong low” zone around the 1.272 extension; if this breaks on a closing basis the entire rebound thesis is likely wrong and the door opens toward the 1.618 around 6455 and even 6375.
A++ Setup 1 – Short fade from 6765–6815 (Tier-1 rejection play)
Entry zone: 6780–6805, leaning as close to 6800 as price action allows after the spike and stall.
Invalidation / hard stop: 6827, above the 4h supply high and the 1.272 line; if price can close above there, the rejection idea is wrong.
Targets and management:
TP1: 6710–6690 (retest of intraday equilibrium and prior 30m shelf). That gives roughly 2R from a 6785–6800 entry with a 20–25 point stop.
TP2: 6645–6625 (London and NY AM lows cluster). This is where you want the bulk of the remaining size off if sellers stay in control.
TP3: 6550–6525 (strong low zone) only if macro tape turns risk-off; treat this as a runner target, not baseline.
A++ Setup 2 – Long continuation from 6660–6680 (Tier-1 acceptance play)
Entry zone: 6670–6680 after the sweep and reclaim; avoid catching the first knife if momentum is still heavy.
Invalidation / hard stop: 6643, below the combined London low band; a 15m close below 6645 means the demand shelf failed.
Initial risk: roughly 30–37 points depending on fill.
Targets and management:
TP1: 6724–6735 (Asia high / intraday range top). From a 6675 entry with a 30-point stop this is just over 1.5R; to keep the setup A++, bias toward entries closer to 6670 or take partials slightly higher, around 6740, where 2R is reached.
TP2: 6765–6815 (4h supply band). This is where you expect strong counter-flow; plan to remove most of the remaining size here.
TP3: 6855–6930 only if price slices through 6815 on strong volume and macro data support risk-on; in that case trail under 1h higher lows rather than using static targets.
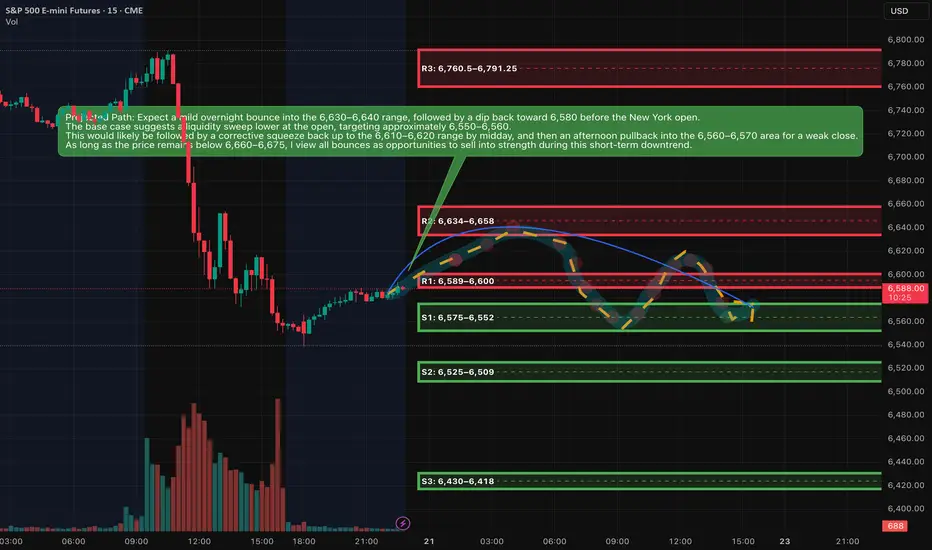
ES (SPX, SPY) Analysis, Levels, PA Forecast, Setups Fri (Nov 21)Analyzing Today’s Sharp Market Decline
The significant selloff observed today was not an arbitrary event. The day began with a robust rally following another impressive earnings report in the AI-chip sector, which propelled futures sharply upward and triggered a short squeeze in the Nasdaq. However, the release of a stronger-than-anticipated jobs report shifted the market's sentiment. While hiring showed signs of rebounding, the unemployment rate also ticked higher, undermining the prevailing narrative that the Federal Reserve would soon lower interest rates.
This development served as a stark reminder of the ongoing restrictive monetary policy, coupled with slowing economic growth and exorbitant valuations in the tech sector. Major investment funds capitalized on the morning’s strength in AI and large-cap stocks as an opportunity to reduce their risk exposure. Additionally, systematic trend-followers faced compulsion to sell once the S&P 500 fell below critical support levels.
The environment for high-beta assets, including cryptocurrencies, is already in a “reset” phase, which left little incentive for dip-buying at lower price points. As the E-mini S&P 500 futures broke through the previous day’s support levels, the situation escalated into a full liquidation. This perfect storm involved trapped long positions from the morning breakout, stop-loss orders falling into execution beneath yesterday’s lows, and mechanical selling, culminating in the largest intraday reversal since the spring.
Market Outlook
The current market sentiment is skewed bearish as the ES remains entrenched below the critical 6,660 to 6,700 range. The price is hovering near a significant demand zone established around the lows of the previous trading day and today’s New York session. While we can expect some upward bounces, these movements appear to be temporary rallies within an ongoing downtrend, rather than indicators of a potential new upward leg.
Market Analysis: Is This the Beginning of a Downtrend or a Temporary Shakeout?
In the recent developments within the E-mini S&P 500 (ES) on the daily timeframe, we’ve observed the formation of a distinct lower high following the recent all-time peak. This shift has seen prices breach the last identified higher-low area, establishing a new narrative. The sequence has transitioned from a higher high to a lower high, culminating in a movement into prior demand zones marked by increased volume, all while momentum appears to be rolling over.
On the four-hour chart, the prevailing trend reflects a series of lower highs and lower lows. The recent selloff has further entrenched this trajectory into the discount zone, now signaling proximity to the next Fibonacci retracement target below.
While momentum indicators have already dipped from overbought conditions, they have not yet reached deeply oversold thresholds, indicating potential for another leg downward following any short-term corrective bounce.
From a broader perspective, the long-term trend remains positive; however, a short- to medium-term corrective phase appears to be in play. Today’s market dynamics suggest we may be in the midst of this corrective leg rather than witnessing the final downturn.
As prices have recently entered a significant demand zone, a bounce lasting one to three sessions—or a period of sideways consolidation—seems likely before any potential further decline.
In summary, while current conditions favor a move towards lower prices in the days ahead, the market likely anticipates a "lower after a bounce" scenario rather than an immediate and steep decline.
Key resistance zones
Resistance is written as bands, not single ticks.
R1: 6,589–6,600
This band sits around the current Asia-session high and the underside of today’s New York low. It is the first lid above price. If rallies stall here, the tape stays heavy and favors another test of the lows.
R2: 6,634–6,658
This is the main breakdown zone from today, centered around the New York afternoon high and the upper edge of the late-session range. As long as ES trades below this shelf, the short-term downtrend remains intact and every bounce is suspect.
R3: 6,760.5–6,791.25
This band covers the New York morning low-to-high range and the origin of the big sell leg. If price ever retests this area and fails, it is a prime region for larger swing shorts. Only sustained trade and closes above this pocket would suggest the current corrective leg is ending.
---
Key support zones
S1: 6,575–6,552
This is the immediate floor combining the Asia-session low, New York afternoon low, and prior-day value low. It is where we are effectively trading now. Expect reactive bounces and stop-runs here, as both sides are active.
S2: 6,525–6,509
This is the next downside magnet if S1 breaks cleanly. It aligns with a fib extension and 4-hour demand. A decisive move into this region would represent the next step down in the correction.
S3: 6,430–6,418
Deeper extension and prior higher-timeframe demand. If the correction matures into a more serious pullback over several sessions, this pocket becomes a reasonable medium-term downside destination.
A++ Setup 1 – Short from R2 supply (continuation short)
Direction: Short
Entry zone: 6,638–6,648
SL (hard stop): 6,678
TP1: 6,588
TP2: 6,552
TP3: 6,515
Invalidation (structure):
If we get a 15m full-body close above 6,675, treat the short idea as invalid and stand aside; market is likely shifting into a squeeze toward 6,700+ instead of extending the down leg.
---
A++ Setup 2 – Quick-reclaim long from S1 demand (counter-trend bounce)
Direction: Long
Entry logic: need a flush then reclaim
Entry zone (after reclaim): 6,562–6,568
SL (hard stop): 6,538
TP1: 6,610
TP2: 6,638
TP3: 6,660
Invalidation (structure):
If price breaks below 6,552 and 15m closes stay below 6,545 without a fast reclaim, the bounce idea is invalid; then you wait for the deeper S2 zone instead of forcing longs here.
Good Luck !!!
Skittish marketThe structure in the daily chart of the S&P 500 implies a skittish market that is moving on concerns that fundamental reality. Therefore I am not looking for a big move down on Friday but rather a rest day and inside day as we go into the weekend.

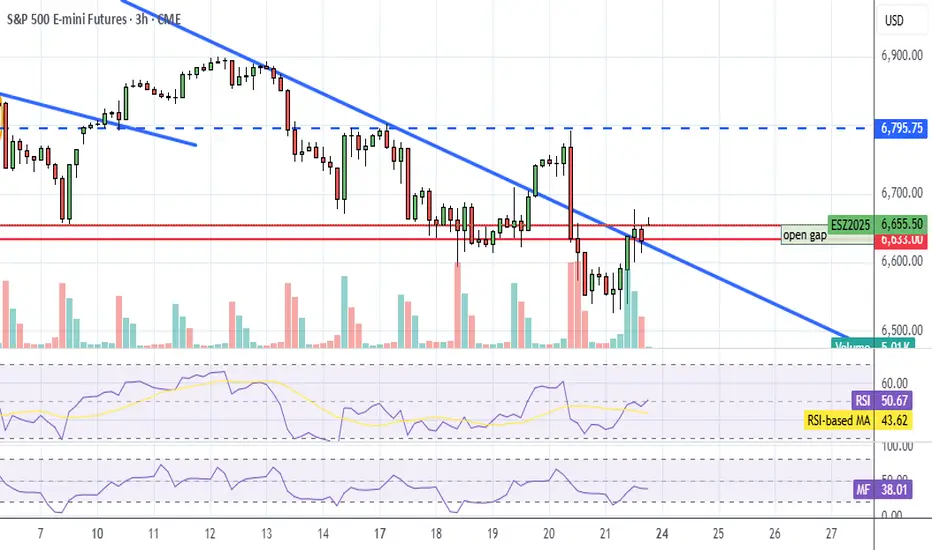
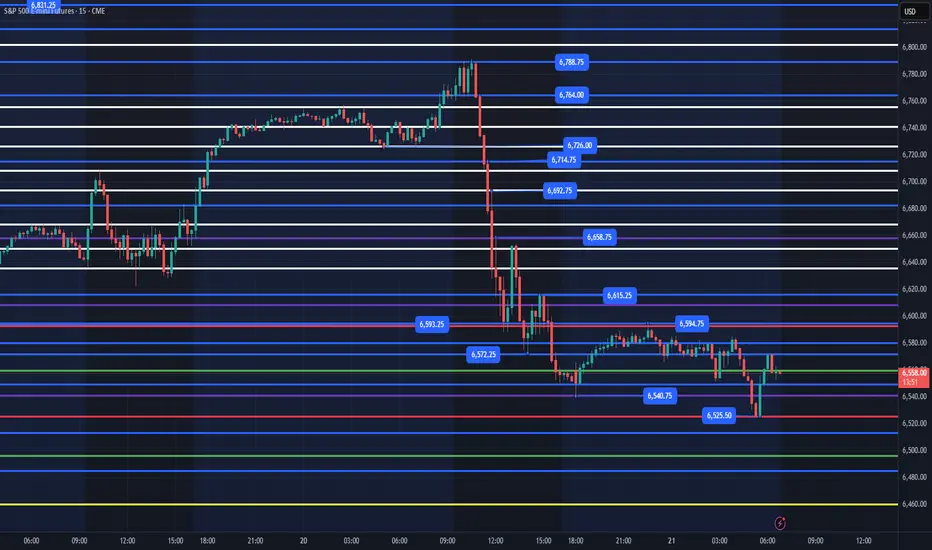
S&P 500 E-mini Futures: Short Target Achieved, Long Setup 21.Nov
S&P 500 E-mini Futures: Short Target Achieved, Long Setup in Play
Today’s session on the S&P 500 E-mini Futures (ES) presented a textbook example of how patience and planning pay off in intraday trading. Let’s break down the trade idea, execution, and the next steps.
Market Context
Instrument: S&P 500 E-mini Futures (ESZ2025)
Current Price: 6,547.25 (-0.16%)
Timeframe: 15-minute chart
Session Behavior: After an initial push higher, the market showed signs of exhaustion near the previous high, creating an opportunity for a short scalp before considering a long re-entry.
Trade Recap: Short Position
Earlier today, a short position was initiated near the supply zone (highlighted in red on the chart) around 6,594.50, targeting a retracement toward the mid-range.
Entry: Around 6,594.50
Target: 6,532.25 (achieved successfully)
Reasoning: Price rejected the upper liquidity zone, forming lower highs and signaling a short-term bearish move. Volume spikes confirmed selling pressure.
This short trade hit its target cleanly, validating the setup and risk management.
Current Setup: Long Bias
With the short target achieved, the focus now shifts to a long re-entry. Here’s why:
Demand Zone: Price reacted strongly near 6,532.25, sweeping liquidity and bouncing back.
Volume Profile: Notice the spike in buying volume at the lows, suggesting accumulation.
Structure: The market is forming a higher low on the 15-minute chart, indicating potential bullish continuation.
Long Plan
Entry Zone: Between 6,532.25 and 6,528.25 (green zone)
Stop Loss: Below 6,523.25 (to protect against deeper liquidity sweep)
Target: Sweep of the day’s high near 6,604.75 or equal highs at 6,594.50 for partials.
Key Observations
Liquidity Sweep: The wick below 6,532.25 suggests stop hunts before reversal.
Risk-to-Reward: Favorable setup with tight stop and clear upside targets.
Market Sentiment: Despite intraday volatility, the broader trend remains bullish, supporting the long bias.
Conclusion
The short scalp was a success, and now the market offers a compelling long opportunity. Traders should monitor price action closely around the demand zone and manage risk diligently. If the bullish momentum holds, a sweep of the day’s high is likely.
✅ Pro Tip: Always wait for confirmation before entering a reversal trade. Volume and price structure are your best friends in identifying genuine shifts in momentum.
Do your own analysis before taking any decisions these are only my way of looking at the market today and valid for today only

Bullish Hidden Divergence Suggests Rally Toward ResistanceThe S&P 500 E-mini bounced off strong support near 6,567, forming a bullish hidden divergence on the MACD indicator. This signals potential upside momentum as price aims to retest the key resistance level at 6,953. Traders should watch for confirmation of this move to capitalize on a possible continuation of the uptrend.

ES - November 18th - Daily Trade PlanNovember 18th- Daily Trade Plan - 6:30am
*Before reading this trade plan, IF, you did not read yesterdays, or the Weekly Trade Plan take the time to read it first! (You can see both posts in the related publication section) *
If my posts provide quality information that has helped you with your trading journey. Feel free to boost it for others to find and learn, also!
My daily trade plan and real-time notes that I post are intended for myself to easily be able to go back and review my plan and how I did from an execution perspective.
--------------------------------------------------------------------------------------------------------
Yesterday, we had good reactions at our key levels. Price ultimately went lower into the last hour of trading, and we got a nice, failed breakdown of 6670 that rallied into the close to finish of the day. You can review yesterday's plan and price action by viewing the post in the related publication section.
Today we have a pretty straightforward plan that I will go over below!
Our overnight high was 6707 (Right below our 6713 level from yesterday). Our overnight low was 6635 which we put in a nice, failed breakdown of 6643. This pattern of price losing a low, then quickly reclaiming that low is a pattern we will continue to see in a volatile and downward trending market. Price is building a really nice base between 6667 and 6684. I anticipate this will continue higher and retest the overnight high of 6707. Any reclaim of 6684 on a back test should give us a good entry or a flush of 6663 and reclaim would take us higher, also. Until price can clear 6715, price is still in a lower high, lower low trend!
Key Levels Today -
1. Loss of 6663 and reclaim
2. Loss of 6635 and reclaim
3. Reclaim of 6684 with a back test of this level for possible entry.
Below we have 6624 and some past weekly levels of 6607, 6592. These levels will be key and the flush of one of them and reclaim should keep us moving higher. The safer place to enter is to wait for it to clear the level from above, back test that level and then enter.
We have Thanksgiving next week and I would not be surprised if price tests the 6540 level by Friday and we rally end of the week as retail and sentiment becomes more bearish.
I will post an update around 10am EST
----------------------------------------------------------------------------------------------------------------
Couple of things about how I color code my levels.
1. Purple shows the weekly Low
2. Red shows the current overnight session High/Low (time of post)
3. Blue shows the previous day's session Low (also other previous day's lows)
4. Yellow Levels are levels that show support and resistance levels of interest.
5. White Levels are previous day's session High/Low
ES - November 19th - Daily Trade PlanNovember 19th- Daily Trade Plan - 7:50am
*Before reading this trade plan, IF, you did not read yesterdays, or the Weekly Trade Plan take the time to read it first! (You can see both posts in the related publication section) *
If my posts provide quality information that has helped you with your trading journey. Feel free to boost it for others to find and learn, also!
My daily trade plan and real-time notes that I post are intended for myself to easily be able to go back and review my plan and how I did from an execution perspective.
--------------------------------------------------------------------------------------------------------
Quick recap of yesterday - Loss of 6635 and reclaim
We lost 6635 at the open and it was a pretty big solid red candle. We then had buyers' step in around 6603 and we had a battle between 6603-6635. We never reclaimed the 6635 level until 11:30am (15 min) candle and that was a great flush below 6603 and reclaim and that was the entry as we can see that price lost a key level (In this case it was weekly and session low) that when reclaimed rallied and you could have entered at any of the key levels above to rally into the 6684 resistance.
---------------------------------------------------------------------------------------------------------
Overnight low is 6614 and overnight high is 6668. As I type this trade plan, price is coming into the 6668 level and is trying to stay above 6658. This should be pretty straightforward today.
Key Levels Today
1. 6614 - We should get one more flush and reclaim of this level before we have to retest yesterday's low at 6595.
2. 6635 - This is the Bull/Bear line in this choppy range between 6684 - 6595. IF we can lose this level and reclaim it should be good for a bounce.
3. 6607 - Any loss and recovery of this level should give us some points.
4. 6595 - Highest Quality level that a loss down to 6581 and recovery should be a good level for points.
Below there and we do not have much of interest until 6570 with 6550 & 6539 the highest quality levels to engage in.
NVIDIA earnings are out after the bell, and my general lean is that price will not do too much today and should continue to chop in this range and overnight could have a sell off down to the 6540 level and then rally and put in the weekly low tomorrow. (This is not information I am trading on, just an observation of how price could react). I will be trading only the flush and reclaim of the levels I have outlined. Remember, we have Thanksgiving next week and I would not be surprised if price tests the 6540 level by Friday and we rally end of the week as retail and sentiment becomes more bearish.
I will post an update around 10am EST
----------------------------------------------------------------------------------------------------------------
Couple of things about how I color code my levels.
1. Purple shows the weekly Low
2. Red shows the current overnight session High/Low (time of post)
3. Blue shows the previous day's session Low (also other previous day's lows)
4. Yellow Levels are levels that show support and resistance levels of interest.
5. White Levels are previous day's session High/Low
ES1 - Scary Face Done, Markets Warming Up
A fast bullish whipsaw recovery needed to arrive or very bearish scenarios could play out.
And now that bullish whipsaw may well be printing to pull the trend out of the fire.
On S&P Futures this may prove to be a slightly lower low liquidity shakeout and moving on up.
If it gets impulsive here then its even possible that the correction is over with no bearish cause carried over.
Stocks are warming up and crypto (TOTAL and BTC) are bouncing from tidy ratios - signalling a potential bottom.
Its been a scary area but this is likely to be the prime dip buy territory.
Assets warming up today may be starting new bull trends whereas assets sitting quietly may not.
This all remains relevant so long as there is not another stock index upside whipsaw.
If there is then its back to the bearish lens - but its looking good here and there are plenty of breakouts in ... stocks.
As said before, the 1.618 is a little way above and that is the next ratio based liquidity juncture.
If S&P can get moving then I think it gets there and we may see some significant bull trends 🧐.

ES - November 24th - Daily Trade PlanNovember 24th- Daily Trade Plan - 7:20am
*Before reading this trade plan, if you did not read yesterday's take the time to read it first! (You can view the posts in the related publication section) *
If my posts provide quality information that has helped you with your trading journey. Feel free to boost it for others to find and learn, also!
My daily trade plan and real-time notes that I post are intended for myself to easily be able to go back and review my plan and how I did from an execution perspective.
--------------------------------------------------------------------------------------------------------
Friday's trade plan had 2 excellent setups with the flush of 6540 and reclaim around 10:45am and the back test of the 6594 breakout around 11:45am. That is all that was needed to have a nice day to end the week.
Overnight we gapped at the open and the overnight high was 6669 and overnight low is 6625. We should have a pretty straightforward day with the following key levels.
Key Levels Today
1. 6625 flush and reclaim
2. 6608 flush and reclaim (could go down to 6594 and then recovery)
3. 6540 flush and reclaim
4. 6524 flush and reclaim
5. 6669 reclaim level and back test to move higher
I will post an update around 10am EST
----------------------------------------------------------------------------------------------------------------
Couple of things about how I color code my levels.
1. Purple shows the weekly Low
2. Red shows the current overnight session High/Low (time of post)
3. Blue shows the previous day's session Low (also other previous day's lows)
4. Yellow Levels are levels that show support and resistance levels of interest.
5. White Levels are previous day's session High/Low
Uptrend Started After Liberation Day - All Has Broken BelowThe US markets have been described as “on a rally” for quite some time. I would not agree if it is meant to describe the overall US market, but would agree if it refers specifically to AI or tech stocks. Why?
Among the four major US indices, the Russell—representing a much broader base of US-listed companies—continues to struggle to break above its high from last year, even though the others have far surpassed it. In fact, it has since corrected by 9.5% since its all-time high just last month.
After that, the other indices are also following suit only in the past few days, breaking below this uptrend that started in April.
Russell has taken the lead and has broken below this trend in late October.
The earliest clue came from the Russell Index, where many suppliers of the Magnificent 7 companies are also part of Russell 2000 components. When the Russell—or smaller-cap companies—starts to weaken, it often reflects broader market pressures that may eventually spill over to the rest of the indices or vice versa.
Video version on the process of how I monitor the four indices and then narrow it down to the individual index.
Micro E-mini Russell 2000 Index
Ticker: M2K
Minimum fluctuation:
0.10 index points = $0.50
Disclaimer:
• What presented here is not a recommendation, please consult your licensed broker.
• Our mission is to create lateral thinking skills for every investor and trader, knowing when to take a calculated risk with market uncertainty and a bolder risk when opportunity arises.
CME Real-time Market Data help identify trading set-ups in real-time and express my market views. If you have futures in your trading portfolio, you can check out on CME Group data plans available that suit your trading needs www.tradingview.com

The Magnificent Seven - A Great Victory with High CasualtyCME: Micro E-Mini S&P 500 ( CME_MINI:MES1! )
The “Magnificent Seven” are the darlings in the U.S. stock market. The seven High-Tech stocks, including Nvidia NASDAQ:NVDA , Apple NASDAQ:AAPL , Tesla NASDAQ:TSLA , Microsoft NASDAQ:MSFT , Google NASDAQ:GOOGL , Meta NASDAQ:META and Amazon NASDAQ:AMZN , are up roughly 21% year-to-date as a group. Together they represent 34-37% of the market capitalization of the entire S&P 500 index.
Meanwhile, the remaining 493 companies in the S&P 500 returned just 12% YTD. Altogether, the S&P 500 index has a YTD return of 13.5% as of November 24th.
During the stock market bull run driven by A.I., a high concentration of the “Mag 7” could generate better returns. An investor could buy the MAGS Magnificent Seven ETF, which invests 100% in the “Mag 7” only. MAGS has a YTD return of 21.0%. A more aggressive investor could play his bet in Direxion Daily Magnificent 7 Bull 2X Shares ETF. This fund aims to replicate twice the return of the “Mag 7” and yield 29.0% YTD.
Minding the Risk of Mag 7 Casualty
The nickname “Magnificent Seven” came from the 1960 American Western. In the plot, a gang of bandits periodically raids a poor Mexican village for food and supplies. The farmers turn to gunslinger Chris Adams for help. Chris assembles a group of seven warriors to fight the gang. They eventually defeat the bandits and save the village.
The Magnificent Seven is my favorite Western movie. The gun fight led by Yul Brynner and Steve McQueen is legendary. And the Oscar-winning theme song is still playing in many grand ceremonies these days.
The analyst who coined the term for the stocks may also be a big fan of the movie. However, he only saw the great victory but overlooked its heavy toll. Four out of the seven warriors perished in the final fight.
A question for today: Could all seven stocks be winners to the end?
In past technological breakthroughs, many big players did not survive, even if they were market leaders at some point and technology did prevail eventually:
• In the Railway boom of the mid-1900s, thousands of railroad companies were formed. At least 300 were listed in the New York Stock Exchange. And 99% of them went bankrupt once the industry consolidated.
• In the automobile boom of the early 1920s, over 600 car makers were founded, and only 30 of them were still operational by the 1930s. And the eventual victors were the Big Three in Detroit.
• In the Internet boom of the 1990s, thousands of startups popped up. And 80% went bankrupt when the dotcom bubble burst in 2000.
• Since Tesla was founded in 2003, over 100 electric vehicle companies were founded. Dozens already folded after burning through cash and not generating sales.
We are seeing the same pattern repeating in renewable energy (solar and wind), computer chips, and now in A.I. startups too. Taken from historical lessons, investing in individual stocks in any transformational new technology sector is highly risky. The leading man could be sidelined as soon as a newer version of the technology comes through.
I have no doubt that A.I. is our future. I just don’t know which of the Mag 7 will survive to the end to collect their $20 payout from the Mexican farmers.
Investing in Micro E-Mini S&P 500 Futures
If an investor is bullish on A.I. but mindful of the single-stock risk exposure, he could explore the CME Micro E-Mini S&P 500 Futures.
The MES contracts offer smaller-sized versions of CME Group’s benchmark S&P 500 futures (ES) contracts. Micro futures have a contract size of $5 times the S&P 500 index, which is 1/10th of the E-Mini contract.
Micro contracts are very liquid. CME Group data shows that 2,349,680 contracts were traded last Friday, November 21st. Open Interest at the end of the day was 298,556.
Buying or selling 1 MES contract requires an initial margin of $2,262. With Monday closing price of 6,677.75, each March 2026 contract (MESH6) has a notional value of $33,388.75 (= 6677.75 x 5). Compared with investing in stocks, the futures contracts offer a built-in leverage of about 14.8 times (=33388.75/2262).
Hypothetically, if S&P futures price rises 10% to 7,012, the price gain of 668 points will translate into $3,340 (= 668*5) in profit for a long position, given each index point equal to $5 for the Micro contract. Using the initial margin of $2,262 as a cost base, the trade would produce a theoretical return of 147% (=3340/2262).
The risk to long Micro S&P is that the US stock market correction continues to deepen. To limit the downside risk, a trader could set up a stop-loss when entering a long position.
For illustration, a trade executed a long trade at 6,680 could be combined with a 6,300 stop. If the S&P falls to 6,000, the trader’s position will be liquidated well before that. The maximum loss would be $1,900 (= (6680-6300) * $5).
Happy trading.
Disclaimers
*Trade ideas cited above are for illustration only, as an integral part of a case study to demonstrate the fundamental concepts in risk management under the market scenarios being discussed. They shall not be construed as investment recommendations or advice. Nor are they used to promote any specific products, or services.
CME Real-time Market Data help identify trading set-ups and express my market views. If you have futures in your trading portfolio, you can check out on CME Group data plans available that suit your trading needs www.tradingview.com

ES - November 21st - Daily Trade PlanNovember 21st- Daily Trade Plan - 6:45am
*Before reading this trade plan, IF, you did not read yesterdays, or the Weekly Trade Plan take the time to read it first! (You can see both posts in the related publication section) *
If my posts provide quality information that has helped you with your trading journey. Feel free to boost it for others to find and learn, also!
My daily trade plan and real-time notes that I post are intended for myself to easily be able to go back and review my plan and how I did from an execution perspective.
--------------------------------------------------------------------------------------------------------
I mentioned the following a couple of times this week in my Daily Trade Plan -
"Remember, we have Thanksgiving next week and I would not be surprised if price tests the 6540 level by Friday and we rally end of the week as retail and sentiment becomes more bearish."
Yesterday's Daily Trade Plan I wrote the following:
"Price can reach 6775-85 area that will be a good resistance level. As I have said many times, when price rallies like it has before the NYSE Open, it could be a trap, and Institutions could start selling around the 6775-85 area. We will need to see what price does in the first hour."
In my note at 1:55pm yesterday I wrote -
"Price is trying to lose the daily low and if we do, we should be looking at 6570 (Reclaim of 6592) or 6540 (Reclaim of 6550) being the next key levels to grab some points. When price has such a massive red day the way it has been on the 1hr chart. It is better to wait for the weekly lows and be patient."
Yesterday it looked like price was going to just take off and we had found our low for the week, then Institutions pulled the rug at 6790 and when you have more than 2 - (15 min red candles) like we did yesterday, just wait and be patient for price to find a low, flush it and recover it. Price tried to recover 6592 late afternoon but couldn't. Since we had a massive red day, we should attempt to retest the levels above all the way up to 6726 at minimum when we get the squeeze higher.
Overnight high is 6594 and the low is 6525. We attempted this am a nice flush and recovery of 6540 (Yesterday's Low) but have found resistance at 6570. If price can take out the 6594 level and back test it to move higher, that would be a nice level to look for points to take us higher. Below that we need to flush 6540 and reclaim or 6525 and reclaim.
I have no idea what price will do today, but my general lean is that we flush 6540 or 6525 and reclaim these levels for a squeeze higher. If price is flushing lower, I will just wait for the reclaim of these levels to ride higher. The other level I will be watching is 6594 and looking for a back test of that level to enter for higher prices.
Key Levels Today -
1. 6540 flush and reclaim
2. 6525 flush and reclaim
3. 6594 take out this level and enter on a back test.
We might only get a sell off down to 6550 with price taking out 6572 would be a good micro level to enter for a test of 6594.
I will post an update around 10am EST
----------------------------------------------------------------------------------------------------------------
Couple of things about how I color code my levels.
1. Purple shows the weekly Low
2. Red shows the current overnight session High/Low (time of post)
3. Blue shows the previous day's session Low (also other previous day's lows)
4. Yellow Levels are levels that show support and resistance levels of interest.
5. White Levels are previous day's session High/Low
S&P500: Poised for Further Pullback The S&P 500 futures are currently trading just above support at 6,540 points, but are expected to see a temporary pullback within magenta wave (4). In our primary scenario, we anticipate the sell-off will extend into the green Long Target Zone between 6,163 and 5,912 points. From this area, we expect the start of wave (5), which would complete the magenta five-wave sequence and push the index higher—ideally above resistance at 6,952 points. This move would also mark the final high of the broader blue wave (III). However, if selling pressure intensifies and the Long Target Zone is breached, our alternative scenario will come into play (probability: 31%). In this case, blue wave alt.(III) would already be complete, and the index would enter a significantly deeper correction phase.
