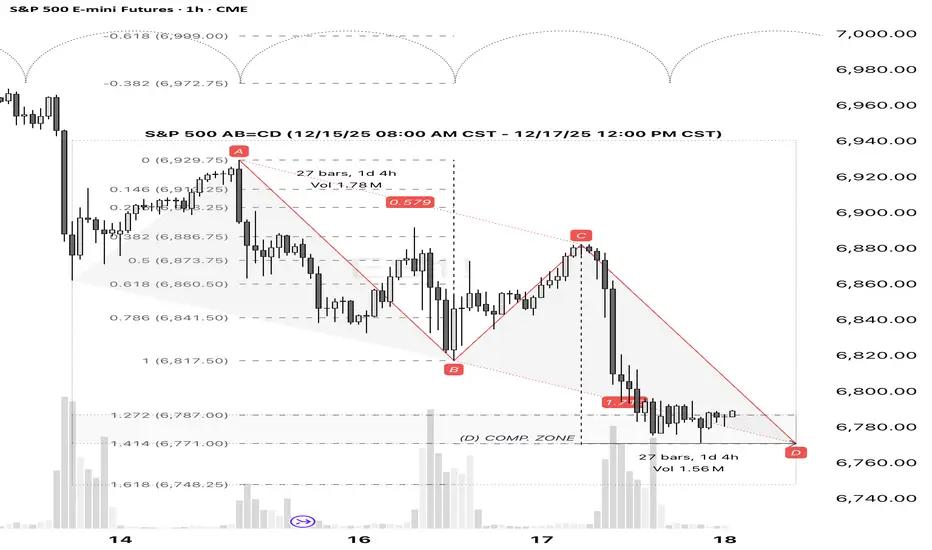
SPX: AB=CD Pattern Completion Suggests Long SetupS&P 500 (SPX) - Technical Analysis: Bullish Reversal Signal at AB=CD Completion
1. Pattern Recognition:
A classic bullish AB=CD harmonic pattern has reached its precise completion point (D). This validates the designated support zone as a significant technical area where buyer momentum is anticipated to overcome recent selling pressure.
2. Market Structure Implications:
The successful completion of this pattern suggests:
· The establishment of a firm, technically-defined support level.
· Exhaustion of the prior downward (CD) leg.
· An increased probability of a mean-reversion move higher, targeting a retracement of the recent decline.
3. Trade Thesis & Risk Management:
The confluence at the D point presents a favorable risk/reward opportunity for a long position.
· Action: Initiate long positions.
· Entry Zone: At or near the pattern's D completion point.
· Invalidation Level: A decisive close below the D point invalidates the pattern structure. Place stop loss accordingly.
· Primary Target: The 0.618 Fibonacci retracement of the CD leg.
· Secondary Target: The initiation point (C) of the pattern.
S&P 500 E-mini Futures
No trades
Market insights
S&P Futures Trading Day 85 — Watching the Market Run Without MeEnded the day +$80 trading S&P Futures. My pre-market analysis spotted a potential breakout from the recent downtrend, with the only major resistance looming ahead at the 6890s. I set my plan to short that resistance and look for longs at the 5-minute MOB. Unfortunately, I was just a step too late on the long entry, and the market ripped higher without filling my order. It’s always frustrating to watch a planned move happen without you, but I stayed disciplined, took the small win on the shorts, and respected the bullish market structure.
📰 News Highlights
S&P 500 CLIMBS AS ONGOING AI-LED REBOUND PUSHES TECH HIGHER
🔔 VX Algo Signals
9:29 AM — MES Market Structure flipped bullish (X3) ✅ 11:20 AM — VXAlgo NQ X1DP Buy Signal ✅ 2:00 PM — VXAlgo ES X3 Sell Signal ✅
3 out of 3 signals worked — 100% accuracy today.
🔑 Key Levels for Tomorrow
Above 6925 = Bullish Below 6900 = Bearish

S&P Futures Trading Day 83 — Riding the Trendline: Bearish ThesiEnded the day +$250 trading S&P Futures. Today was a textbook session where the morning analysis played out perfectly. My bearish thesis was strong right out of the gate, based on the price being under the trendline and confirming the bearish market structure. I opened my short positions at the open and set a crucial batch of orders at the 2-hour MOB. The market played out exactly as anticipated, delivering a clean profit day. It's always satisfying when the planning, structure, and execution align this well.
📰 News Highlights
*DOW, S&P 500, NASDAQ END LOWER AS TECH STOCKS TUMBLE AHEAD OF JOBS REPORT
🔔 VX Algo Signals
9:30 AM — MES Market Structure flipped bearish (X3) (Assuming Yes, aligning with thesis) ✅ 10:00 AM — VXAlgo NQ X3DP Buy Signal (Assuming No, as it's a Buy signal in a Bearish Market) Yes 1:30 PM — VXAlgo ES X1 Oversold signal (Assuming Yes, marking the low) ✅
🔑 Key Levels for Tomorrow
Above 6925 = Bullish Below 6900 = Bearish

ES Daily setupCME_MINI:ES1! are we seeing a daily liquidity sweep followed by a reaction move then a retracement to a FVG?
If this is the case we could be seeing a long setup to take us to all the time highs again. With the holidays and everything I imagine ATHs would be hit in the start of the new year.
IF it remains valid.
ES Premarket UpateES formed a pennant and MFI is moving up.
So this could be the start of the Xmas rally.... we'll see what happens today.
I'm all cash right now

SP500 Remains Bullish After The FED MeetingS&P 500 has made a very nice retracement recently; in fact for almost the whole November we have seen a pullback of around 5 to 6%, which is quite a lot for the S&P 500, and what is really important is that the market has stopped around the 6500 area, which basically goes back to October 10th when we saw a massive sell-off on that Friday when Trump threatened with new tariffs on China. But afterwards, as you can see, the market recovered, so it looks like a very beautiful rebound from that zone with impulsive characteristics, even beyond the diagonal and trendline resistance lines. This likely confirms that bulls are ready to resume higher into a potential fifth wave, which can be made by a new lower-degree five-wave bullish cycle. Ideally, new trend will resume soon after the current setback that can be flat in wave 2, so be aware of a bullish continuation into all-time highs and 7k are, possibly still this month.
After the FED meeting last week, we can see it making an irregular flat correction in wave (2) that can find the support at 6800 area, so soon be aware of a bullish resumption within wave (3).

ES (SPX, SPY) Analysis, Key Zones, Setups for Wed (Dec 17th)Market Update: ES Faces Critical Decision Point
The ES market is currently navigating a narrow “decision pocket” between 6850 and 6865, following a significant selloff and a subsequent bounce that has yet to establish a definitive trend. The situation is clear: buyers must defend the lower range of 6834 to 6817 to maintain market stability within this range. Conversely, sellers are focusing on the upper threshold between 6880 and 6892. With the Consumer Price Index report scheduled for release on Thursday morning, traders are likely to become more reactive, potentially taking profits swiftly and responding sensitively to any news regarding interest rates.
What can move ES tomorrow (high-impact catalysts, ET)
7:00 MBA Mortgage Applications - usually a modest mover, but it can nudge rates early.
8:15 Fed Governor Waller (Economic Outlook) - big rates sensitivity; ES can whip on any change in tone.
9:05 NY Fed President Williams - opening remarks at an NY Fed conference; still headline-capable.
10:30 EIA Weekly Petroleum Status Report - can move crude and inflation expectations, which can leak into ES.
11:00 Treasury buyback details (eligible bonds list) - rates pulse risk.
1:00 20Y Treasury auction (competitive bids) - one of the bigger intraday “rates steering wheel” moments.
1:40-2:00 Treasury buyback operation window - can add another yields swing in the early afternoon.
Macro and News Themes to Watch Ahead of Tomorrow’s Market
In the current environment, interest rates are proving to be the primary driver of market dynamics. Any increase in long-term yields exerts downward pressure on the equity markets, particularly when key indices like the S&P 500 are hovering near critical resistance levels.
The Federal Reserve's messaging remains notably inconsistent. While some officials are emphasizing the importance of maintaining inflation credibility and adopting a cautious stance towards future rate cuts, others suggest that monetary policy is already positioned effectively and anticipate a gradual cooling of inflation. This divergence creates a volatile atmosphere, leading to heightened market reactions surrounding Fed speeches.
On the geopolitical front, oil prices are responding to ongoing developments, particularly concerning Venezuela, which has raised supply-risk concerns. This uptick in crude prices has the potential to reinforce inflation narratives and influence equity market sentiment.
Additionally, the looming Bank of Japan (BOJ) meeting, where a rate hike is expected, adds another layer of complexity. Even ahead of this anticipated move, shifts in foreign exchange and global rates could significantly impact U.S. index futures and overall market positioning.
Overnight NY Market Forecast
Base Case Scenario: The market is expected to trade within a range of 6832.75 to 6880.50. Watch for potential retracements towards the 6849.00-6849.75 level, which appears to be a pivotal support point.
Bullish Scenario: Should the index manage to sustain a position above 6880.50, a decisive break above 6892.00 would likely drive prices towards 6936.25, a key resistance level.
Bearish Scenario: Conversely, a confirmed drop below 6817.50 would pave the way for a test of 6800.00 initially. If sellers maintain their grip on the market, further declines to 6767.75 and 6733.75 may follow.
A++ Setup 1 (Rejection Fade short from the upper shelf)
Entry: 6887.00-6891.75
Hard SL: 6896.25
TP1: 6863.50
TP2: 6849.75
TP3: 6834.50
A++ Setup 2 (Acceptance Continuation short under PDL)
Entry: 6814.50-6817.25
Hard SL: 6823.75
TP1: 6800.00
TP2: 6767.75
TP3: 6733.75
Good Luck !!!

ES (SPX, SPY) Analysis, Key Levels, Setups for Thu (Dec 18)TOMORROW EVENT STACK (ET)
07:00 - Bank of England rate decision + statement
04:00 - Norges Bank rate decision (Norway)
08:15 - ECB policy statement release
08:30 - CPI (Nov) + Real Earnings (Nov)
08:30 - Initial Jobless Claims
08:30 - Philly Fed Manufacturing (Dec)
08:30 - ECB press conference begins (adds FX noise, CPI still dominates ES)
High-impact window: The peak whip risk occurs from 08:30 to 08:45 ET. After the market opens at 09:30, it often either continues the 08:30 trend or reverses back to fair value.
October CPI Release and Its Implications
The absence of the October CPI data from the Bureau of Labor Statistics (BLS) introduces significant complexity to the upcoming November CPI release. Notably, the November figures will omit certain one-month percent changes due to the missing October data. This gap is likely to lead to increased volatility in market reactions, as traders may rely more heavily on year-over-year comparisons and overarching narratives. It's important to emphasize that this presents a data-quality risk rather than a straightforward price forecast.
Current projections from Reuters indicate a CPI rise of 0.3% month-over-month, with a year-over-year increase of 3.1%. Additionally, core CPI is expected to mirror this 0.3% monthly change, while the year-over-year core figure is anticipated to remain at 3.0%. These benchmarks represent the market's baseline, and any significant deviation—either a miss or beat—could trigger a pronounced market reaction.
Navigating Market Dynamics: A Practical Guide for E-mini S&P Traders
- Hot Scenario: A core CPI increase of 0.4% or more, or any unexpected data that raises inflation concerns, is likely to drive yields upward. In this case, E-mini S&P futures may see selling pressure on initial rebounds, as traders react to renewed inflation fears and test support levels.
- Cool Scenario: Conversely, if the core CPI prints at 0.2% or below, or if there’s a clear downside surprise against expectations, we might witness a drop in yields. This scenario could facilitate a breakout for E-mini S&P futures, allowing for upward progression through resistance levels as shorts are squeezed.
- In-Line Scenario: The market may react chaotically to the initial news, but typically, direction stabilizes upon the first pullback following the 09:30 cash market open.
To ensure effective trading during the CPI release, adhere to the following guidelines:
1. Avoid initiating new positions in the final 60 seconds leading up to the 08:30 release.
2. Establish four key reference points: the high and low of the pre-CPI trading range (08:20-08:29) and the high and low resulting from the CPI spike (08:30-08:33). These levels frequently serve as pivotal points for price action during the first 30 to 90 minutes of trading post-release.
By keeping these dynamics in mind, traders can better navigate the potentially tumultuous waters of the upcoming CPI announcement.
Market Analysis: Short-Term Outlook
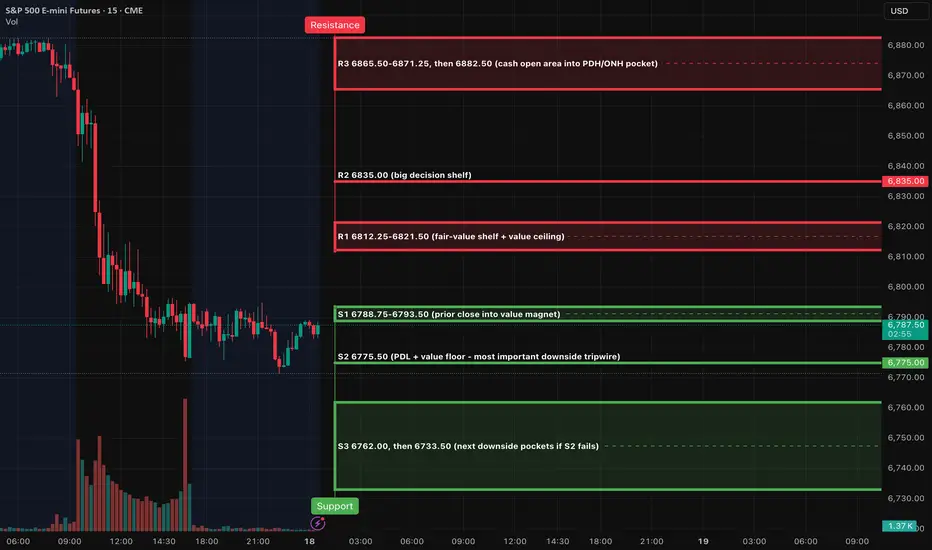
In the broader context, the recent trading action suggests a failure to maintain momentum after reaching the upper resistance band. The most recent price structure indicates a downward trend, with the market currently trading below key resistance levels. For upcoming sessions, this is critical; any attempts at upward movement will need to overcome the 6821-6835 range to signify a genuine reversal rather than mere corrective action.
On the 4-hour timeframe, we observe a distinct sell-off followed by a consolidation phase. There are several resistance zones left untested from the recent decline, which could hinder any potential rallies. The immediate resistance is located between 6812 and 6821, with a higher barrier at 6835. Should the price exceed 6835, it might have the potential to rally toward the 6865-6882 range.
The 1-hour perspective reveals a classic pattern characterized by a sharp decline followed by a basing phase. Notably, trading volume surged during the sell-off before tapering as prices stabilized near the close. This dynamic sets the stage for either a rebound toward immediate resistance levels or a further decline if the established support fails.
The oscillator is currently in a deeply oversold position, registering in the low teens and beginning to show signs of a potential upward turn. This development suggests some bounce potential, although it does not guarantee a trend reversal on its own. A credible shift in trend will require the price to reclaim the R1 resistance and maintain levels above R2.
Overnight Market Outlook: NY Session Forecast
Base Case Scenario (Pre-CPI): Anticipate a period of rotational trading between support level S2 at 6775.50 and resistance range R1 at 6812-6821.
Bullish Scenario: Should the market hold at S2, a reclaim of R1 would be crucial. A successful transition of R2 (6835) from a resistance level to a support floor could propel prices toward R3 (6865-6871), with the potential to reach 6882.50 if bullish momentum remains strong.
Bearish Scenario: Conversely, if the market slips below S2 and fails to reclaim the 6775.50 level, we could see a decline towards S3 at 6762, with a further slide to 6733.50 if selling pressure intensifies.
A++ Setup 1 - Short Position (Rejection at Resistance Level 1)
Entry Criteria: Monitor the market for a minimum of 30 minutes. The ideal entry is between 6816.00 and 6821.00.
- Stop Loss (SL): 6838.00
- Take Profit (TP) Targets:
- TP1: 6775.50
- TP2: 6762.00
- TP3: 6733.50
**Invalidation Point:** The setup will be invalidated if price sustains above 6835.00.
A++ Setup 2 - Long Position (Continuation through Resistance Level 2)
Entry Criteria: Again, monitor for a duration of at least 30 minutes. The target entry range is between 6830.00 and 6836.00.
- Stop Loss (SL): 6818.50
- Take Profit (TP) Targets:
- TP1: 6871.25
- TP2: 6882.50
- TP3: 6936.25
Invalidation Point: The trade will be considered invalid if there is a decisive drop back below 6821.50 after the reclaim action.
Good Luck !!!
ES (SPX, SPY) Analyses, Key Levels, Setups for Tue (Dec 16th)
As we head into Tuesday, ES is showing signs of structural weakness following a significant sell-off, culminating in a late dip into the 6845-6840 demand zone. The prevailing trend appears to be downward as long as prices remain beneath the resistance range of 6863-6874. However, the 6845-6840 support still has the potential to trigger a rebound. Traders should anticipate the most decisive price action around major data releases, followed by a phased, level-to-level approach in trading strategy.
EVENTS THAT CAN MOVE ES (ET)
2:00am UK labor data
3:15am-5:00am Eurozone PMI batch + ZEW sentiment window
8:30am US jobs data bundle + Retail Sales + Earnings + Unemployment
9:45am US Flash PMI
10:00am Business Inventories
4:30pm API oil stats (can hit energy tone into the close)
Market Outlook: NY Session Forecast
In the upcoming New York trading session, we anticipate a period of consolidation likely to include a modest rebound attempt. However, this upside movement is expected to face resistance within the range of 6859 and 6863-6874. Should sellers maintain pressure and keep prices below 6863 as we head into the session, we could see a subsequent pullback towards the 6845-6840 range, followed by a potential drop to 6825.
On the bullish side, if the market can decisively reclaim and sustain levels above 6874, we might open the door for a rally towards 6902 and possibly 6923.
Conversely, a clear breach below 6840 that lacks immediate recovery signals strengthens the bearish outlook, targeting 6825 initially, with the potential for a further decline to 6800-6790.
ES Short (A++) - Sell 6863-6874 - SL 6876.50 - TP1 6845-6840 TP2 6825 TP3 6800-6790
Key zones
Support - 6845-6840, 6825, 6800-6790
Resistance - 6851-6859, 6863-6874, 6902, 6923-6936
A++ Setup 1 - Short (ceiling fade)
Entry - Sell 6863-6866 after a rejection from 6863-6874
Stop - 6876.50 (above the rejection high)
TP1 - 6845-6840
TP2 - 6825
TP3 - 6800-6790
ES Long (A++) - Buy 6825 reclaim - SL 6814.25 - TP1 6863 TP2 6902 TP3 6923
A++ Setup 2 - Long (flush then reclaim)
Entry - Buy 6825-6828 only after price reclaims and holds above 6825
Stop - 6814.25 (below the flush low)
TP1 - 6863
TP2 - 6902
TP3 - 6923
Good Luck !!!

ES (SPX, SPY) Week-Ahead Analysis (Dec 15-19, 2025)Market Overview: The Week Ahead
This week marks a pivotal moment for the markets as focus shifts from narratives to hard data. Key economic indicators will be released, including U.S. jobs figures on Tuesday and the Consumer Price Index (CPI) on Thursday, both scheduled for 8:30 AM ET. Additionally, the Bank of Japan will convene on December 18-19, with a consensus anticipating a 25 basis point hike, bringing rates up to 0.75%.
In a week filled with significant releases, we often see market behavior akin to a compressed spring - characterized by volatility as traders await fresh data, followed by a rapid price adjustment once new information emerges.
Historically, the most lucrative trading opportunities materialize at the edges of established price ranges, rather than in the middle.
Technical Analysis: Trading Structure
Weekly Outlook
The broader market structure remains constructive, although current trading suggests we may be nearing what appears to be a “ceiling zone” following a recent advance. This level could facilitate rapid upside movements, albeit sustained acceptance is proving more challenging. Notably, momentum is easing rather than collapsing.
Daily Perspective
The daily market profile indicates a potential recovery phase following significant liquidation. Buyers seem to be regrouping to establish a solid base, while sellers are actively defending against upside pressures. This dynamic often results in pronounced intra-day fluctuations but tends to exhibit limited follow-through absent a triggering catalyst.
4-Hour Analysis
Recent trading patterns align with a classic sequence: an initial impulse downward followed by a corrective consolidation. In such market conditions, rallies hitting resistance levels are often mere tests rather than true breakouts until prices can convincingly maintain levels above key ceilings.
On an intraday basis, the market is currently in a tight range above the Volume Weighted Average Price (VWAP), frequently encountering resistance at the same overhead levels. This setup typically leads to one of two outcomes: either a pop-and-fail at resistance which presents a clear short opportunity or a flush-and-reclaim at support offering a viable entry for longs.
Investors should remain alert for market responses to the upcoming economic data, as this will likely set the tone for price movements in the days ahead.
Risk Pricing Analysis: Current Market Sentiment
As we assess the current market landscape, it's clear that we are not in a state of panic; however, there are signs that market participants are pricing for potential tail risks.
The VIX spot index stands at 15.74 as of December 12, indicating a moderate level of volatility expectations. Similarly, the MOVE index, which measures the volatility of interest rates, is at 69.25 on the same date, reflecting some instability in that realm.
In credit markets, we see a High Yield Option-Adjusted Spread (OAS) of 2.88 on December 11, suggesting that conditions remain orderly despite the slight increase in risk premiums. Notably, the SKEW index is currently at 153.59, indicating that crash insurance is priced considerably rich compared to historical norms, signaling investor concerns about downside risk.
The put/call ratio is at 0.91 with a 10-day moving average of 0.86, which does not indicate extreme levels of fear among traders. Additionally, market breadth reflects a somewhat subdued environment, with 221 advancing stocks versus 280 declining stocks on December 12. While this does not signify outright capitulation, it suggests that overall market strength is lacking.
In summary, the prevailing market conditions appear to favor sharp reactions to new catalysts, with the expectation of mean-reversion unless volatility in credit and rates begins to escalate.
The catalyst calendar that can flip the trend
Tuesday Dec 16 - 08:30 ET
US Employment Situation for November is scheduled for release.
Thursday Dec 18 - 08:30 ET
US CPI for November is scheduled for release, plus Real Earnings.
Important nuance for this CPI
Because of the 2025 lapse in appropriations, the CPI release has documented limitations (missing October data prevents some 1-month changes from being published). That can widen the interpretation range and produce bigger price swings than a normal CPI day.
Thursday Dec 18 (global central banks)
• BoE is widely expected to cut 25 bp to 3.75%.
• ECB is expected to hold the deposit rate at 2% next week.
BOJ Dec 18-19
Baseline expectation is a 25 bp hike from 0.50% to 0.75%, with guidance as the bigger lever.
**Why the Bank of Japan Influences U.S. Stocks: An Analytical Perspective**
The Bank of Japan (BOJ) functions as a global “funding thermostat.” When its monetary policy is anchored near zero, it indirectly fosters a stable environment for risk assets globally, as funding remains inexpensive and reliable. Conversely, tightening measures from the BOJ can ripple through financial markets, impacting not only Japan but also the broader global financial system.
Here’s a breakdown of how BOJ actions affect U.S. stock indices:
1. Yen Channel (Risk Appetite):
A rate hike or hawkish signals from the BOJ typically strengthen the Japanese yen. A stronger yen can compel investors to trim risk exposure in their portfolios, especially in positions sensitive to foreign exchange fluctuations and funding costs. This de-risking effect often hits high-beta equities first, leading to notable adjustments in U.S. markets.
2. Global Discount-Rate Channel (Valuations):
As Japanese yields rise and global term premiums stabilize, the discount rate applied to U.S. equities tends to increase. This scenario generally poses challenges for long-duration equities, particularly growth-oriented stocks. A decline in this growth-heavy leadership can drag down the overall index, even amid a stable economic backdrop.
3. Cross-Border Flow and Hedging Channel (Subtle Pressure):
Japan is a significant investor in foreign assets (especially US). Changes in domestic yields can alter the appeal of these foreign investments and the associated hedging costs. It’s not necessary to witness a dramatic repatriation for market movements to occur; even modest reallocations, coupled with adjustments in hedging strategies, can tighten financial conditions incrementally.
4. Timing Channel (Gaps):
The BOJ typically makes its announcements during U.S. off-hours, heightening the likelihood of gaps in futures trading (like the E-mini S&P 500). Such gaps can disrupt typical intraday trading patterns, forcing traders to navigate wider risk parameters as they react to fresh information.
Practical Implications:
A surprise hawkish stance from the BOJ increases the odds of the E-mini S&P 500 testing lower support levels initially (S2 followed by S3/S4). Conversely, if the BOJ’s communication aligns with market expectations and is accompanied by a calm demeanor, the resultant market reaction may function as a temporary impetus, quickly yielding the spotlight back to upcoming U.S. jobs data and CPI readings.
Geopolitics and Inflation: Key Insights for the Week Ahead
This week, energy risk has resurfaced on the market’s radar. The U.S. seizure of the Venezuelan oil tanker M/T Skipper, accompanied by intensified enforcement actions, has disrupted Venezuelan export flows and sparked increased discussions about potential supply disruptions. These developments are crucial, as headlines related to oil tend to boost inflation expectations, particularly just before the Consumer Price Index (CPI) release.
The situation in the Middle East remains precarious, with ongoing developments regarding the stability of a ceasefire in Gaza heightening sensitivity to geopolitical headlines. This uncertainty adds an additional layer of complexity to market dynamics.
Meanwhile, the normalization of shipping routes is unfolding at a sluggish pace. A return to operations in the Suez/Red Sea lanes is expected to be a gradual process, with estimates suggesting a 60-90 day transition period once it officially commences.
On the economic front, the tone surrounding China’s growth appears to be softening. Recent figures show November industrial output rising by 4.8% year-over-year and retail sales increasing by just 1.3% year-over-year, indicating a weakening momentum in demand.
Analysts will be closely monitoring these developments, as they could significantly influence market trends and inflation forecasts in the near term.
Navigating NY Sessions with Precision
In analyzing the upcoming New York trading sessions, it’s crucial to establish a clear scenario map that demarcates potential trading paths based on market behavior around key data releases.
The most probable trading scenario is expected to involve two-way trades within established price shelves, characterized by potentially sharp price movements during the Tuesday and Thursday 08:30 data releases. Historically, such movements have a tendency to mean-revert towards the Volume-Weighted Average Price (VWAP) and Point of Control (POC) unless the incoming data significantly deviates from market expectations.
For traders anticipating a bearish extension, key triggers include sustained price acceptance below 6828.50, the Yearly Point of Control (Y-POC), followed by failure to reclaim 6810.50 (Yearly Value Area Low). Acceptance below 6805.00 the previous day’s low would solidify this bearish outlook. In this scenario, any rallies are likely to be viewed as opportunities to “sell the bounce” until a market reclaim signifies strength.
Conversely, a bullish surprise may unfold if prices hold above 6850.00, particularly post-data release. A reclaim of the 6889.50 to 6896.25 range, establishing it as a support floor, could trigger a short squeeze, pushing prices towards 6903.00 and subsequently 6915.50. This bullish path would be contingent on genuine acceptance above these levels.
Trading Execution Strategy
To navigate these scenarios effectively, traders should focus on optimal execution windows during the New York AM session from 09:30 to 11:00, and in the PM session from 13:30 to 16:00. It’s advisable to treat the Tuesday and Thursday 08:30 data releases as distinct trading regimes; traders should observe initial market impulses before seeking to capitalize on subsequent moves from established price shelves.
Risk management is paramount. A pass-fail gate is established whereby the first take profit (TP1) should be positioned at a minimum of 2.0 times the risk from the predefined stop, ideally anchored to a 15-minute candle wick or market structure. Limit trading attempts to two per level per session, implementing daily guardrails to exit positions at a loss of -2R and securing profits at +3R.
Good Luck !!!

ES - December 19th - Daily Trade PlanDecember 19th- Daily Trade Plan - 6:15am
**Note - ES Contracts have rolled over on Trading View from December (ESZ2025) to the March (ESH2026) Contract. I have adjusted the levels on my charts and trade plan to reflect changes.
*Before reading this trade plan, if you did not read yesterday's take the time to read it first! (You can view the posts in the related publication section) *
If my posts provide quality information that has helped you with your trading journey. Feel free to boost it for others to find and learn, also!
My daily trade plan and real-time notes that I post are intended for myself to easily be able to go back and review my plan and how I did from an execution perspective.
--------------------------------------------------------------------------------------------------------
We are currently in a range between 6771-6870 with 6820-22 being the bull/bear line. Today is OPEX and trading can be difficult on most OPEX days as we typically will not get much follow through and is a key reason you need to pick your levels, wait for the flush and reclaim, enter and manage the trade up to the next level.
The overnight low is 6820 and the overnight high is 6853. This range and breakout or breakdown should determine the direction of the next leg that we have been consolidating for.
I have mentioned many times this week that we are still in a downtrend until we can break above and hold 6892. If we lose 6800, we will most likely need to retest the lows of the range.
Key Levels Today
1. 6835 - Flush and Reclaim (Lower Quality)
2. 6822 - Flush and Reclaim (Liquidity is dwindling in this level)
3. 6771 - Flush and Reclaim (Highest Quality)
4. 6747 - Flush and Reclaim (High Quality if we break lower)
Below 6771 and 6747 is the next level I would look to engage. I do not like OPEX days and it is imperative not to overtrade or trade inside the noise. Everything between 6853-6820 is pure chop. Below or above and it should take us in that direction.
I will post an update around 10am EST
----------------------------------------------------------------------------------------------------------------
Purple = A Weekly Low (Current or Previous Week)
Blue = A previous day low (Day before or day in the past week)
Red - Overnight Session High/Low (Prior to my post)
White = Key Support/Resistance Levels

ES - December 16th - Daily Trade PlanDecember 16th- Daily Trade Plan - 5:50am
**Note - ES Contracts have rolled over on Trading View from December (ESZ2025) to the March (ESH2026) Contract. I have adjusted the levels on my charts and trade plan to reflect changes. March is roughly 60pts above December and is why yesterday's levels prices are way different than today's.
*Before reading this trade plan, if you did not read yesterday's take the time to read it first! (You can view the posts in the related publication section) *
If my posts provide quality information that has helped you with your trading journey. Feel free to boost it for others to find and learn, also!
My daily trade plan and real-time notes that I post are intended for myself to easily be able to go back and review my plan and how I did from an execution perspective.
--------------------------------------------------------------------------------------------------------
Since we are using the new contract levels, I will keep today simple and not discuss yesterday as it may be confusing. Overnight high is 6883 and our Overnight low is 6833. Yesterday our low was 6865 and as I am typing this trade plan, price is currently trying to clear and hold the 6865 level. When looking at price you can see that we are in a downtrend and price needs to clear 6929 to continue to move higher.
Key Levels Today -
1. 6865 - Flush and Reclaim
2. 6833-37 - Flush and Reclaim
3. 6812 - Flush and Reclaim
4. 6792 - Flush and Reclaim
Below 6833 and we should get a decent bounce at 6812, we will most likely find a better low around the 6792 level.
We have Employment Data coming out at 8:30am EST. I will post an update once we see the reaction. I will most likely not find any trading opportunities until after the NYSE open but will focus on price action and the levels in my plan.
I will post an update around 10am EST
----------------------------------------------------------------------------------------------------------------
Purple = A Weekly Low (Current or Previous Week)
Blue = A previous day low (Day before or day in the past week)
Red - Overnight Session High/Low (Prior to my post)
White = Key Support/Resistance Levels

ES - December 15th - Daily Trade Plan December 15th- Daily Trade Plan - 7am
*Before reading this trade plan, if you did not read yesterday's take the time to read it first! (You can view the posts in the related publication section) *
If my posts provide quality information that has helped you with your trading journey. Feel free to boost it for others to find and learn, also!
My daily trade plan and real-time notes that I post are intended for myself to easily be able to go back and review my plan and how I did from an execution perspective.
--------------------------------------------------------------------------------------------------------
Last week we closed around the same level as the previous week. While we tried to get above the 6925 level, we could not hold above it to keep the momentum heading higher.
This week we have some economic data coming out and we can expect some volatility as we head into the last week of heavy trading volume for the year. This week should set the tone for the remainder of the year.
The overnight session low is 6823 and we have some clear levels that have held since we rallied into the overnight session high of 6865 (as of writing this post). 6851 is our first immediate support and 6843 being a level that should hold if we want to keep going higher. Price is in a tough spot for new entries this am as we are looking to continue higher to back test the 6885 level. You might be able to find an entry on the back test of 6865 if we can clear it to 6870 then back test 6861-65
Key Levels Today -
1. 6843 - Flush and Reclaim (Lower Quality)
2. 6823 - Flush and Reclaim (High Quality)
3. 6801-05 - Flush and Reclaim (Highest Quality)
I will post an update around 10am EST
----------------------------------------------------------------------------------------------------------------
Purple = A Weekly Low (Current or Previous Week)
Blue = A previous day low (Day before or day in the past week)
Red - Overnight Session High/Low (Prior to my post)
White = Key Support/Resistance Levels

Consensus Pays Off (If You’re Careful)The S&P 500 is closing out another strong year. Year to date performance is up 16%, despite a recent slowdown over the past month. A 16% annual gain is notable and exceeds the S&P 500’s 25-year average return, even though it trails the outsized rallies of the past two years.
Looking Back at 2025
This year’s rally has been driven by a narrow group of sectors, while others have lagged the benchmark. Year to date, only the AMEX:XLK (Technology), AMEX:XLC (Communication Services), and AMEX:XLI (Industrials) select sector ETFs have outperformed the broader S&P 500. A common thread across these sectors is their exposure to the AI theme. Heavy AI related capital spending has fuelled gains throughout the year, despite recent concerns around elevated valuations.
The XLC (Communication) highlights Alphabet and Meta as its top holdings, both key beneficiaries of the AI rally. The XLK (Technology) is led by market heavyweights such as VANTAGE:NVIDIA , ERRANTE:APPLE , ERRANTE:MICROSOFT , and NASDAQ:AVGO (Broadcom). Notably, strength in the XLI (Industrials) is also tied to AI spending. The infrastructure behind large scale AI data centers, along with the construction equipment needed to build them, comes from major ETF constituents such as $Caterpillar and GE Vernova.
In contrast, sectors including AMEX:XLRE (Real Estate), AMEX:XLE (Energy), and AMEX:XLP (Consumer Staples) have posted largely flat performance. This reflects sector-specific headwinds such as softer consumer spending, tariff effects, a slowing housing market, and lower oil prices.
Sector selection is clearly crucial. While many investors search for potential undervaluation, aligning with the prevailing market consensus can at times deliver stronger results. At the start of 2025, most analysts were broadly bullish, with forecasts pointing to 5% to 15% equity growth and a consensus near 10%. Mint Finance highlighted several of these outlooks in an earlier paper . In practice, equities outperformed even the upper end of these forecasts, despite a volatile year.
Analysts also entered the year expecting further gains in technology, driven by AI. As noted in a State Street report earlier this year, “This suggests that investors continue to expect a narrow US, tech, large cap, quality led equity rally. And this is our base case, as well.” That base case has played out, with large cap technology stocks leading market performance.
Similarly, JP Morgan made an early call on rising power demand, highlighting opportunities in power generation and infrastructure. The firm noted, “Overall, we expect power demand growth in the United States to increase by 5x to 7x over the next 3 to 5 years. Investors looking to capitalize on the growing demand for power can focus on broad infrastructure funds, power generation, and utility companies.” This theme has been reflected in strong performance from industrial names such as Caterpillar and GE Vernova.
While maintaining a balanced perspective is important, following a well-supported consensus view can help investors track closer to benchmark performance. Combining this approach with prudent hedging as conditions change can offer a simple and effective strategy.
Hold Consensus, Deploy Hedges
While the consensus view looks to have panned out in hindsight, it wasn’t a straightforward rally.
Sharp drawdowns, such as the one in April, would have made the position loss-making with the magnitude of losses (-20%) exceeding many common risk tolerances.
Alternatively, a simple hedging approach using MES futures to implement a beta hedged short can result in a more resilient portfolio. The analysis applies a short position of one MES futures contract when MACD signals bearish momentum. While the strategy creates a modest drag on overall performance, its benefits during drawdowns are clear. It reduces downside risk by 12% to 14%, at the cost of only 3% to 4% of upside performance.
For example, in the analysis, a hedge is first deployed on 21 February after the MACD turns negative. This involves initiating a short position in MES March futures at an entry level of 6,029. The hedge is maintained until the MACD turns positive on 19 March, at which point the position is exited at 5,729. This results in a profit of USD 1,500 ((6,029 - 5,729) x 5). Similar hedges are implemented each time the MACD signals a shift to negative momentum.
While this approach could be further refined by incorporating additional risk signals, even a simple MACD based strategy delivers a clearly improved payoff profile compared to an unhedged position. For reference, the hedged portfolios also exhibit meaningfully higher Sharpe and Sortino ratios.
What Looks Interesting In 2026
Looking forward to 2026, buy side analysts have started to highlight that opportunities outside of technology may be more lucrative as the rally gets stretched.
Within AI, beneficiaries should continue to broaden out from the innovators (tech) to the enablers (industrials, utilities) and the adopters (financials, health care). Traditional value sectors like energy and consumer staples may continue to struggle due to low oil prices and a deteriorating low-end consumer spending, while financials boast resilient earnings and differentiated catalysts like deregulation and yield curve steepening.
~ JPM 2026 Year-Ahead Investment Outlook
The adoption of Artificial Intelligence (AI), tax incentives, deregulation and shrinking public-sector employment will likely lead to a productivity boom. (O/W U.S. Equities, O/W U.S. Industrial Policy Beneficiaries, O/W AI Adopters (Defense), O/W Bank Loans, O/W U.S. Regional Banks)
~ Morgan Stanley 2026 Outlook
While Industrials and utilities look like a solid consensus bet to benefit from increasing CAPEX, we can assess additional metrics across sector ETFs, including analyst forecast upside, technical ratings, and recent fund flow trends.
Based on analyst price targets reported by TipRanks, the highest upside is seen in XLK at 21.9% and XLC at 17.5%. Outside of technology, XLRE at 16.6% and XLU at 15.8% also offer notable upside potential.
From a technical perspective, XLF stands out with a strong buy rating on the one-week timeframe, indicating a recent acceleration in momentum. In contrast, XLK, XLRE, and XLU, despite favourable analyst upside, are currently showing weaker technical signals, with ratings below Buy.
Fund flow data over the past month shows sizable inflows into XLI (Industrials) and XLV (Healthcare), suggesting active rotation into these sectors. Meanwhile, XLB (Materials) and XLF (Financials) have experienced notable outflows, pointing to capital rotation away from these areas.
Taken together, these indicators and analyst consensus forecasts for 2026 suggest that XLI (Industrials), XLC (Communication Services), and XLU (Utilities) stand out as top sector candidates. While meaningful upside may still exist in XLK (Technology) and XLRE (Real Estate), both appear more fragile, with technology facing valuation concerns and real estate dependent on an uncertain recovery.
To implement a consensus based hedged strategy similar to the one outlined, traders could take long positions of 209 units of XLI, 284 units of XLC, or 1,178 units of XLU. These position sizes allow for effective beta hedging using CME Micro E-mini S&P 500 futures. The figures are based on ETF market prices as of 15 December.
To calculate these values independently, the following formula can be used:
Units equivalent to the notional represented by a Micro E mini S&P 500 futures contract
= (MES futures price × 5) ÷ ETF price ÷ ETF beta
This approach ensures that ETF exposure is appropriately sized relative to the futures hedge.
Alternatively, traders could replicate the hedges directly using CME’s suite of equity index sector futures. Futures contracts are available for the sector ETFs discussed, as well as for additional select industry and broader equity indices. These instruments can be used in several ways.
First, they can replicate long ETF exposure with lower capital requirements. The maintenance margin on these contracts allows traders to deploy positions up to 20 times larger with the same amount of capital.
Second, they enable more precise hedging. Rather than adjusting MES futures by the beta of each sector, traders can use the corresponding sector futures to create more exact hedges aligned with the underlying exposure.
This content is sponsored.
MARKET DATA
CME Real-time Market Data helps identify trading set-ups and express market views better. If you have futures in your trading portfolio, you can check out on CME Group data plans available that suit your trading needs tradingview.com/cme .
DISCLAIMER
This case study is for educational purposes only and does not constitute investment recommendations or advice. Nor are they used to promote any specific products, or services.
Trading or investment ideas cited here are for illustration only, as an integral part of a case study to demonstrate the fundamental concepts in risk management or trading under the market scenarios being discussed. Please read the FULL DISCLAIMER the link to which is provided in our profile description.

ES - December 17th - Daily Trade PlanDecember 17th- Daily Trade Plan - 6:35am
**Note - ES Contracts have rolled over on Trading View from December (ESZ2025) to the March (ESH2026) Contract. I have adjusted the levels on my charts and trade plan to reflect changes.
*Before reading this trade plan, if you did not read yesterday's take the time to read it first! (You can view the posts in the related publication section) *
If my posts provide quality information that has helped you with your trading journey. Feel free to boost it for others to find and learn, also!
My daily trade plan and real-time notes that I post are intended for myself to easily be able to go back and review my plan and how I did from an execution perspective.
--------------------------------------------------------------------------------------------------------
We are pretty much at the same place we were yesterday when I started typing up my daily trade plan. The key difference is that we have been consolidating into a massive overhead resistance trend line at the 6882 level. Our overnight low is 6838 and our overnight high is 6882. I stated yesterday that when looking at price you can see that we are in a downtrend and price needs to clear 6929 to continue to move higher.
I wrote yesterday on the 10:58am - Update
"Price respected 6845 and has rallied into the 6862-65 resistance. I would not be chasing at this level. Price needs to cool off and build a base above 6847 for price to continue higher. At this point, I need price to come back and lose 6833 and reclaim 6839 for me to look at my last trade of the day. 6822, 6812, 6795 are key levels below today's low if price wants to flush lower."
Price did give us this exact move in the afternoon, we lost 6833 down to 6817, reclaimed the 6822 level and short squeezed higher. I missed this trade as I was away from my desk but did get a solid trade in yesterday morning.
We are looking for similar levels today to get some points from. Price may continue to move higher without much of a pullback today. Price really needs to hold 6838 or we will most likely retest 6822 and potentially lose that level. 6864 is first support down and any flush and reclaim should give us a good bounce.
Key levels Today
1. 6864 - Flush and Reclaim (maybe down to 6858ish)
2. 6851 - Flush and Reclaim
3. 6838 - Flush and Reclaim
4. 6822 - Flush and Reclaim
Below these levels and price should put in a decent sell off and I will be looking at 6812, 6795, 6766 as key levels to get a bounce.
I will post an update around 10am EST
----------------------------------------------------------------------------------------------------------------
Purple = A Weekly Low (Current or Previous Week)
Blue = A previous day low (Day before or day in the past week)
Red - Overnight Session High/Low (Prior to my post)
White = Key Support/Resistance Levels

ES UpdateES and NQ RSI barely touched oversold at the end of the day. Based on the closing action I assume inflation numbers will suck tomorrow, that and YM and RTY are not oversold yet.
I think tomorrow will be the reversal day and we get a Xmas rally. Unless inflation numbers are real low in which case we'll see a gap up.

ES - December 18th - Daily Trade PlanDecember 18th- Daily Trade Plan - 5:50am
**Note - ES Contracts have rolled over on Trading View from December (ESZ2025) to the March (ESH2026) Contract. I have adjusted the levels on my charts and trade plan to reflect changes.
*Before reading this trade plan, if you did not read yesterday's take the time to read it first! (You can view the posts in the related publication section) *
If my posts provide quality information that has helped you with your trading journey. Feel free to boost it for others to find and learn, also!
My daily trade plan and real-time notes that I post are intended for myself to easily be able to go back and review my plan and how I did from an execution perspective.
--------------------------------------------------------------------------------------------------------
While yesterday we had some actionable levels, price was trading very quickly, and it did not have much follow through. I wrote on the 10:55am - Update
"When price is selling off, we do not need to rush in. If price does not act like it wants to hold a key level after it has been reclaimed (5-10 mins of showing price wants to hold the key level) then no need to rush in for a trade. Personally, I like to give it enough time to show its hand because if it rips 40pts I can find a level above that I can enter. Trying to pick a bottom will drain your account. Typically, when price sells below the overnight low and the previous day low, I let price decide when it wants to find a good bottom. As of typing, 6800, 6777 could be key levels that could give us a short squeeze."
Tuesday's low was 6822 and while there was a big battle at the 6838-40 level, we finally lost it down and price flushed lower while building a nice base overnight. You can see that price found its daily low at 6776.25 (.75 below the key level I provided above)
It is important to look at overnight price action as we are currently in a very clear failed breakdown of yesterday's low. We flushed the 6776 level overnight down to 6771 around 10:30pm and then reclaimed that level and we have been moving higher since.
The overnight low is 6771 and overnight high is 6808 as of typing this daily plan. Immediate support is 6795 and today should be pretty straightforward on levels we can grab points. The challenge will not be easy... WHY? It is CPI at 8:30am EST and this economic event can move price 100+ points either direction. I will be waiting to see what price does between 8:30am-9:30am and will be patient to see how price opens up in the first 15 mins.
As I have stated all week, we continue to be in a downtrend and the recovery of 6864, 6882 should change the current trend. Until then we need to focus on price action and key levels we can grab some points.
Key Levels Today -
1. 6795 - Flush and Reclaim
2. 6784 - Flush and Reclaim (Overnight micro level)
3. 6776 - Flush and Reclaim
There are some obvious levels reclaims at 6808, 6822, 6840 but price needs to clear 6840 to give it a chance to go higher. These levels that are reclaimed, the back test and hold of those levels should produce some points.
The first obvious setup should we get it prior to 8:30am is the flush and reclaim of 6795 (maybe down to 6788-90). Price built a nice base overnight at 6784 and this should be an actionable level.
Below 6771 and 6748 is the next best level to wait for a flush and recovery.
I will post an update around 10am EST
----------------------------------------------------------------------------------------------------------------
Purple = A Weekly Low (Current or Previous Week)
Blue = A previous day low (Day before or day in the past week)
Red - Overnight Session High/Low (Prior to my post)
White = Key Support/Resistance Levels

ES UpdateNQ should hit oversold tomorrow, the question is whether or not ES and RTY also have to hit oversold before the market bounces.
Open gap above, but that will fill eventually when Supreme Court nullifies Trump's tariffs.
Took a chance and went long on GM calls this afternoon, held it because of the EOD pump. Could be a mistake holding calls when I know the market is headed down, but GM seems to be doing its own thing and melting up. Didn't really track the market at all today.
In any case, futures are red, and I'll go long on other stocks when ES hits oversold.
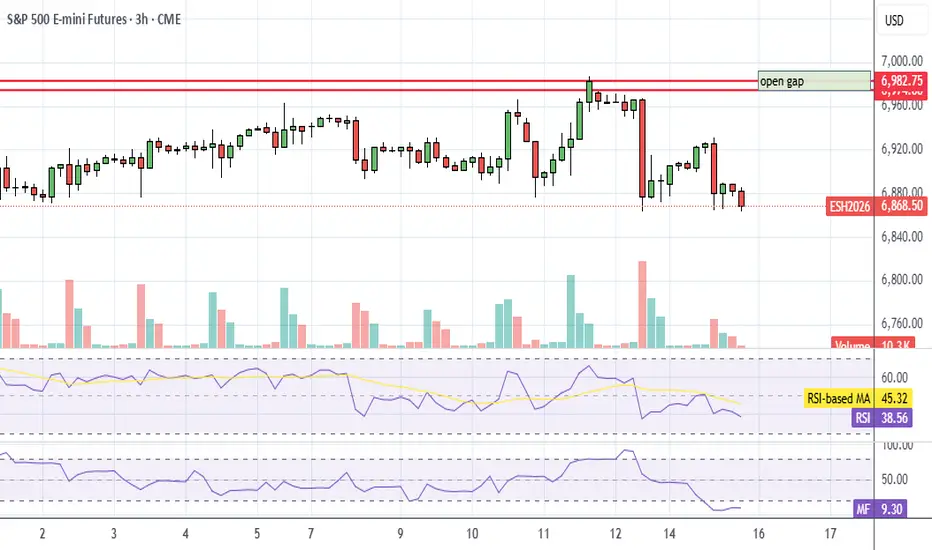
ES UpdateRSI didn't hit oversold, but keeps bouncing up because MFI hit oversold.
Too much whipsaw for me, I'm staying cash for now, probably not trading tomorrow.
Inflation numbers Thu.

From Shutdown Relief to AI Anxiety — Two Narratives Driving ESMarket Theme
The week began on a strong footing, driven by a bullish Sunday reopen in ES after news broke that the 43-day government shutdown was set to end, following the Senate’s late-night support for a potential agreement on November 9th. This relief catalyst created early upside momentum, pushing the index toward all-time highs (ATHs).
However, the tone shifted mid-week. The rally lost steam as markets refocused on a growing concern: the sustainability of current Tech and AI valuations. Investors are becoming more sensitive to the possibility of overstretched AI-related capital expenditure and an emerging bubble narrative, especially with heavyweight earnings and forward-guidance looming. This led to a rotation out of high-beta tech and into safer or less-extended sectors.
On the macro front, Fed speakers adopted a more cautious—if not outright hawkish—tone, emphasizing that a December rate cut is far from assured. The recent government shutdown created a backlog in key economic data releases, leaving policymakers and traders alike without clear visibility into the true state of the economy. The lack of data has amplified uncertainty and reduced the market’s conviction around the timing of any potential policy easing.
In short:
The market is caught between two opposing forces:
The optimistic narrative (shutdown resolved, path to ATHs, resilience in U.S. growth), and
The risk narrative (valuation excess, policy uncertainty, narrowing breadth).
This push-pull dynamic has resulted in compression rather than continuation, with a heavy focus on clarity from upcoming data and major earnings.
What is the Market Doing?
Last week formed an inside week, with the entire range trading within the prior week’s range and settling close to the previous week’s close. This signals indecision and balance, as neither buyers nor sellers had the conviction to push the market into expansion.
Current price action shows the market compressing between:
6875 — previous week’s VPOC / 27 Oct weekly VAL
6740— 13 Oct weekly VAH / 10 Nov weekly volume ledge
These levels are well-defined and respected. The upward trendline continues to hold, with multiple strong rejections signaling responsive buyers stepping in to bid prices back up.
The battle is now between buyers attempting to defend 6740 area which is also confluent with the daily trendline support, and sellers leaning on the overhead resistance close to 6875.
What to Expect in the Coming Week
The key line in the sand (LIS) this week:
→ 6755.25 — Previous week's settlement
Bullish Scenario
If 6755 holds as support, expect buyers to attempt a push toward:
6874.50 — previous week's VPOC
6905.5— weekly 1-SD volatility high
Anticipate responsive sellers in this area.
However, if price breaks above 6874.50 with pace and volume and accepts above it, the path opens for a retest of the ATHs as momentum players and trapped shorts fuel continuation.
Bearish Scenario
If the market accepts below 6755 and fails to reclaim it on any pullback:
First downside target: 6660 — 13 Oct weekly VAL
If buyers fail to respond there, expect an acceleration lower from long liquidation toward:
6605— weekly 1-SD volatility low
6504 — previous month's low (deeper target)
This scenario strengthens if the trendline breaks and sellers begin stepping down aggressively.
Neutral / Compression Scenario
If the market remains trapped between 6875 and 6740 with no breakout supported by pace and volume:
Expect two-way rotational trade
Continued compression and balance within the well-defined range
A buildup of energy that may resolve later in the week with data, earnings or fundamental catalysts
Conclusion
As we start the new week, ES remains tightly coiled between well-defined levels, with the market waiting for clarity from data, earnings, and policy signals. Whether we break from compression or continue to balance, the key will be how buyers and sellers respond around 6755 and whether there are new fundamental catalysts.
As always, I’d love to hear your view on the markets and ES this week? — Drop it below — and give it a boost so more of the community can join the conversation.
Glossary Index for all technical terms used:
VAH (Value Area High)
VAL (Value Area Low)
VPOC (Volume Point of Control)
SD (Standard Deviation)

Confident closeThe daily chart in the S&P 500 closing price implies confidence going into the weekend. The expectation for Monday though is a positive move but a smaller range.

ES UpdateLooks like all we get is a morning pump from inflation numbers. I bought and flipped some GM calls in the morning because it didn't gap up like everything else. Noticed that the movement was slower than usual so I flipped it on the gap fill (yesterday morning's gap). Glad I did.
If you look at the intraday chart, you'll also notice it had resistance in the morning, and that's never a good sign, so I bought and flipped some IBIT (shitcoin) puts as well, lol.
Probably should have bought some puts EOD, oh well. Futures now red.

Look at about four marketsDecember 16th think there are some markets that look like they're ready for reversal and that includes the oil market and some of the aggressive markets like the gold and the silver might be key ready to correct a little bit and I talk about that and they talked about S&P mini. I'm going to state here that I'm intentionally looking at markets that aren't quite ready to trade necessarily but we're in that part of the market where they may actually end up trading in the direction that we're looking for in other words if I want to trade oil I have an idea that I want to be a buyer when the market on oil is going lower so I wait for the market to go lower and I'll be I will be looking at the market this week as we see what goes on with the market and if I use my analysis I have a chance of spotting that market even though I talked about it a day or two earlier..... It's about using your time to find an opportunity and then having a little bit of patience to look a little bit longer if you need to and then you take the trade as a opposed to constantly looking at the market and wondering about the trade you're going to take and it's you're doing it every day and you don't have a plan. I spent time on Tesla as well.
