Futures forming possible inverse cup & handleWaiting for a handle on the chart which should hopefully signal a downward trend for futures. I see a possible inv h&s forming on the 5 day. 👀
ESZ2018 trade ideas

ES1! with both short and long term levelsThis is my trading idea for ES1! for both long and short-term.

ES Outlook for 11-27 Week We are approaching an area of resistance with the composite value area from the ATH lingering above us. Does not mean we will see a sharp rejection, but could mean that buyers really need to step up or else we risk a phase of balance and or rotation lower.

ES - Neutral - 4th Week of NovemberAdmittedly my bias on ES is contradicting my bias on NQ. ES is still respecting bullish PDAs but also failing to displace above highs. ES still has 60 day highs in tact. If these highs are not taken out by Wednesday, I will consider the possibility that the high of the week has been established. DXY also still has 60 day lows in tact so a reach higher on ES is not out of the picture at all. Neutral here on ES & am able to play both sides. I will be scalping this week until a clear displacement lower occurs.
The 4 Hour /ES Chart Has a 3 Marching Lemmings Warning Sign.The /ES forming a "three marching lemmings" MACD warning sign. This is when the product makes at least 3 successive highs, but the MACD makes 3 successive lows. This could indicate a near term change in direction, if a break of a defined trendline occurs.

ES chart bias analysis for next week/monthWe have liquidity a daily sweep and price have been failing to close above the high. We are in a bullish market, however for price to keep going up, it needs some fuels. So this week and the first weeks of December we might experience a bearish retracement for price to reach the ultimate buyside liquidity before the end of the year.

Updated SP500 Analysis. FORECASTS REMAINS UNCHANGEDHas Elliott Wave Lost Its Forecasting Accuracy?
I cannot recall the exact setting, but many years ago I was asked this specific question…
” …as the number of practitioners of Elliott Wave Theory grows due to its popularity, won’t more people be trading these wave patterns and in doing so, somehow skew the theory’s efficacy”?
It’s a great question.
One in which I think requires a more nuanced, rather than simple answer. Forecasting markets using Elliott Wave Theory (EWT) is only as accurate as the practitioner. With respect to EWT, if one could consider being in a renaissance of sorts, I would say, now is that time, because of the increase in practitioners . Since R.N. Elliott’s final published work, Nature's Law –The Secret of the Universe published in June, 1946 several individuals have contributed to the theory in incremental ways. However, this article is not about the history of Elliott Wave theory, but a thought experiment in the continued efficacy of what I would consider to be the only effective and comprehensive analytical tool that describes the price movements of markets.
If there is one phrase, I have used over the years to explain short term pattern ambiguity it would be…
“Nothing clears up the current price action, like more price action”.
Meaning, at times, an objective practitioner of EWT can decipher a pattern in different ways, and what will deem the current pattern, optimal , will be the price action that follows. This is the primary reason I include alternative counts within all my published work. However, I am a purist in the pursuit of arriving at a truth. Using EWT, I find the truth mostly has two potential outcomes, and only the price action that follows will lean more so towards one, rather than the other. That is why I believe that when one shares their work with the public, (like here on Trading View) it should be their own work, and not a concoction of other people’s work posted on the Internet, and peddled as one’s own. As a trader, I think there are no rules that govern the pursuit of profit. As an analyst, I believe when sharing an analytical forecast, it should be the work of the one posting. Explaining how I determine some people are posting analysis that is an aggregation of other public postings is of less importance than remaining on topic in relation to the efficacy of EWT in forecasting. Last year, I was rated the top author on Solana, a crypto currency. I no longer share my analysis on Solana with the public. However, a quick search of current analysis on Solana yields ideas that lack context, or make bold predictions, that I can say are not based on a rules-based forecasting tool like EWT. This is one method I use to discern the analysis is either not their own, or is not worthy of using hard earned money to get behind. Solana, as a chart falls into the category of having one primary analytical thesis, and an alternate for me. Ironically, in this case, they both point higher towards triple digits. I see nothing posted on Solana here that contains the context of why prices have moved higher and where they will go over the very long term. Additionally, there is nothing contained with the Solana chart that tells me new lows are option to be considered. Yet, some with say that is precisely where that crypto currency is headed.
I often wonder when substandard analysis is shared with the public does it change the optimal pathway of correct analysis. It's impossible to know for sure. However, it seems reasonable to think that the longer-term targets would not change, but the smaller timeframe sub-divisions might. This may lead to more short term complex patterns, but in the grand scheme of things, the efficacy of EWT I do not think is harmed. Traders who follow EWT analysis may find mixed results. That is why if you follow anyone else's analysis on the Internet, make sure they are providing details, context, the nuance behind what could happen, versus shallow context and a lack of a well thought out thesis. It is possible, you're reading someone's else's work, interpreted and passed off as their own.
This leads me to my updated analysis on the SP500.
My last post on the SPX futures was on October 28 which was one day after the market bottomed. The purple pathway I deemed low probability. In retrospect, this is precisely what has played out. However, now that price has rallied swiftly higher, I have to consider yet another possibility.
The blue count in the chart above.
As of this morning, both my primary black, and first alternative count, has the index in a c wave lower towards the lower 3,000 area. Black subdivides more so than purple, but they ultimately arrive in the same area. The blue count requires some explanation and the context to warn followers of this sort of price action will play out. Regardless of my primary, first or second alternate counts, a retrace should begin soon. In the case of black and purple, those retraces turn into impulsive patterns towards my target. However, in the case of the blue second alternative, that retrace will take the form of a 3-wave pattern, but ultimately reconcile higher. This resulting higher price action can be for a new high in primary B, or an even higher high resulting in new all-time highs, as v of 5 of Supercycle wave (III). The interesting aspect of either of those moves higher results in an ending diagonal by virtue of overlap that occurred on October 27th 2023.
THIS WILL RESULT IN A MARKET CRASH SCENARIO.
Price will return to their point of origination, which in the case of a new primary B wave high, that price originated at 3502 in October of 2022. In the case of new all-time highs for wave (III) in the super cycle degree, that is the Covid-19 bottom at 2191, which occurred in March 2020. Therefore, I'll conclude by saying that we should all expect a retrace lower to start as early as next week. To what extent, will determine the direction of the SP500 into the first half of 2024. Is there a possibility of the index making a new high? Current price action suggests I cannot rule that out...but so far, (Even this very impressive November 2023 rally) leads me to believe anything has occurred to make me change my original forecast of 3200-3300 in the SPX Futures.
If we do decide to go up and make new highs...I think for this trader, that may be cause to get flat assets in general and to the degree it makes sense. I'm referring to assets directly AND indirectly associated with the stock market.
Best to all,
Chris

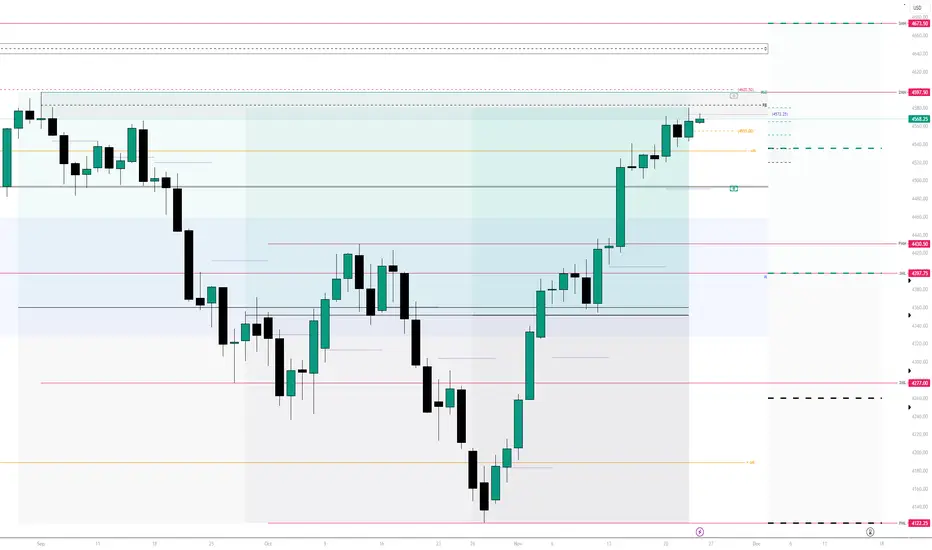
11/25 Trading Plan - Friday Recap and Day Ahead🔄 Recap
In the past month, the S&P 500 Index Futures (ES) has demonstrated an unusual bullish trend, closing four consecutive green weeks. Notably, after breaking out of a downtrend channel on November 14th at 4425, the market has largely maintained an upward trajectory. This breakout signifies a classic technical analysis pattern typically seen in 4-month downtrend reversals.
🔍 Key Structures
4620: Represents a significant trendline connecting the January 2022 COVID bull market high with the August 2022 most recent high.
4577-80: A major resistance level encountered back in late August/early September.
4536-42: A critical horizontal zone that served as key resistance during the summer of 2023.
Other Notable Levels: 4507, 4488-90, 4445, 4436-32, 4408-11, and 4390.
📉 Support Levels
The primary support levels to monitor include 4507, 4488-90, 4445, 4436-32, and the critical 4408-11 zone. These levels have historically played a significant role in the market's movement and will be crucial in determining future trends.
📈 Resistance Levels
Key resistance levels to watch are 4577-80, the upper zone of 4536-42, and the overarching 4620 level. These levels have previously acted as barriers to upward movement and will be critical in assessing the potential for continued bullish momentum.
📝 Trading Plan
Supports to Monitor: 4554, 4549, 4542, 4535, and other major supports down to 4408-11.
Resistances for Potential Reversal: 4565, 4572, 4580, and upwards to 4620.
Bull Case Scenario: Maintaining above 4542-36 on dips to continue the bullish trend.
Bear Case Scenario: A breakdown below 4536-42 could signal a short-term bearish shift.
🔚 Wrap Up
As the market transitions from the Thanksgiving holiday, traders should be prepared for potential volatility and abrupt changes in direction. The emphasis should remain on trading within pre-planned, high-conviction zones and reacting to market shifts rather than predicting them. The approach for Monday hinges on the market's ability to sustain support levels, particularly around 4542-36, to continue the upward trend or signal a bearish reversal if these levels fail.
Disclosure: This is not financial advice and is for informational purposes only. Please consult a professional financial advisor before making any investment decision.

A clear deviation between NQ and ES CME_MINI:NQ1! CME_MINI:ES1! We can see that the ES chart is weaker and more "bearish" than the NQ. That means in the next week open if ES breaks the checkpoint "1" we can easily see an ATH for NQ , because we have already broken the checkpoint "1" on NQ . So I think the direction and the sentiment of NQ are highly based on whether ES breaks above or bellow the checkpoint "1" . We should also wait to see where the weekly gap will open. Up or down the current weekly close.

Doge... a higher low and off we go!Thanks giving rally for DOGE?
It amazes me how we have all been "programmed" to endorse grotesque holidays like today in the USA. It is a massive compilation of sins against love.
We normalize killing the wildlife to feed our food addiction (hunger aversion - switching the system over to fasting is slightly uncomfortable) yet we have plenty of plants to eat while we enjoy the scenery of inter galactic national park "space ship earth". You see, taking a life without it's consent incurs massive karmic debt, preventing ascension to the frequencies of love... ya know.. the one thing we all crave most? unconditional love?... and then we are told to drink it off (poisoning ones self with the alcohol tool, used to sterilize and kill life, is not love of self). dehydrating the Sensor prevents communication on the frequencies of LOVE... leaving us all ripe for corruption of out perspective on what love is, for the benefit of the greedy and the powerful.
And we can most look forward to the normalized occasion to re-up our sugar addictions for the month with a massive DOSE of pie. I need that FIX. right along with an entire country of addicts. sugar... the gateway drug to capitalism.
a spectacular low vibrational holiday to white wash the genocide of North America, while simultaneously surrendering our power to the now matrix of capitalism and the now corrupted US government. . a system intended to regulate industry and break up conglomerates. a governance intended to represent the people in the face of runaway greed fueled capitalism.
my favorite part, is that we label this addiction indoctrination, murderous, alcoholic, glutenous, holiday for addicts as THANKFUL and GIVING... when it is none of those things... it embodies major sins against love, crippling our population to vibrational levels of fear based decisions and virtual servitude, as we destroy life on this planet too, all thanks to the runaway game of "monopoly" our great grand fathers started here. It's time to break free of the things that we give our power away too, and start living a life based on the forces of LOVE, not FEAR.
DOGe coin feels like the coin of unconditional love... like a dog.

Higher prices on US500 11/23/2023its a Bank holiday. probably not gona see anything of importance today. the generated liquidity pools on the upside are crazy. yesterday i piramided to the equal highs nut got broken even. if today at regular trading hours there is a setup i will take it anyways. go on 5 min chart or 1 its so much clearer there.

ICT Unicorn on ES 15MICT Unicorn short setup - breaker aligned with FVG.
Target Asia session Low for 1:2 RR

SPY ANALYSIS 11/22Hey Guys, this morning there was a big liquidity grab - which I anticipated because the PCC was over 1.4 yesterday- so I expected price to go up until PCC fell below 1- which is what happened today. Now after shaking off shorts with this manipulation - I think we now have room to go down to the red trendline. If trendline breaks we can expect a gap down. Again from a macro prospective, I do think we will hit ATH around the EOY. Follow for more.


ES In mark down phase. False Rally Feb 24' Bottom 3950Market structure dictates that we are in a stage 3 downtrend, or the mark down phase. I sold all of my shares of SPY and am sitting on cash waiting for this false fake rally to sizzle out and continue the downtrend back down to the middle of the first accumulation zone of 3950.
I will continue to buy in the new accumulated zone around February and March 2024 around 3950-4000 area. Prime buying zones. Bullish channel. I am still bullish until 5250. From 5250, I will expect that to be the top before a massive 36% sell off back down to 3150.
This fake rally will sucker in a ton of buyers thinking this is the next leg up only to be disappointed when after the holidays it starts to dump. I will look for sells when day trading until then.

ES 11/22 MACRO ANALYSISAs we can see - we have had a tremendous move upwards for the past few weeks in a channel. We have reached the lower trendline area along with a FVG- so it may be a good place for retracement - however it is important to note that the stock markets are manipulated so if there are a tremendous amount of shorts at this point there will be a short squeeze and prices will continue to go up in this manner. I am expecting extremely choppy price action for the next few days and will trade accordingly.


11/22 Trading Plan - Tuesday Recap and Day Ahead🔄 Recap
The S&P 500 futures (ES) are continuing the seasonally bullish trend of Thanksgiving week. Recently, ES exhibited a bullish triangle pattern around the 4536 resistance, leading to a breakout that aligns with our analysis from the last newsletter.
📈 The Markets Overnight
🌏 Asia: Down a bit
🌍 Europe: Up
🌎 US Index Futures: Trending Up
🛢 Crude Oil: Down significantly
💵 Dollar: Up a bit
🧐 Yields: Down
🔮 Crypto: Up strongly
🌏 Major Global Catalysts
Four-day ceasefire in the Israel-Hamas conflict.
Drama ahead of the OPEC meeting after a sudden reversal of its cancellation.
Decrease in Thanksgiving dinner costs by 4.5% from last year.
🔍 Key Structures
4622: Core trendline connecting the January 2022 COVID bull market high with the August 2022 high.
4577-80: A major resistance level observed in late August.
4543-35: A critical resistance level, now the most important zone to hold.
4521-18: A vital support level that has been crucial in the recent rally.
4488: An important zone for back-testing as the first major support down.
4445-47: A key back-test support level post-CPI day breakout.
📉 Support Levels
Major Supports: 4556-58, 4542, 4536-38, 4521, 4488, 4446-48, 4400-4405.
📈 Resistance Levels
Major Resistances: 4577-80, 4607-09, 4623, 4658.
📝 Trading Plan
Short-Term Focus: Watch 4536-38 for potential bearish indications.
Long-Term Strategy: Bulls remain in control; maintain focus on key supports for signs of sustained upward movement.
🔚 Wrap Up
As we get closer to Thanksgiving, market strength is typical, yet vigilance is essential. Despite predominantly green indicators this month, cautious trading is advised due to potential shifts during the holiday week and overhead supply considerations.
Disclosure: This is not financial advice and is for informational purposes only. Please consult a professional financial advisor before making any investment decision.

S&P SELL AND BUY POSITIONHope you have follow my tips yesterday, should be WIN the LONG side.
Today 21 Nov 2023:
LMT ORDER Buy@4545.75, TP@4553, SL@4537.5
LMT ORDER Sell@4553, TP@4531, SL@4561
Good Luck everyone!!!
#makeTradeSimple

S&P 500 Sell & Buy PositionSELL@4530.25 , TP@4515.75, SL@4539.5
BUY@4545.75, TP@4560, SL@4537
Good Luck everyon!!!

11/21 Trading Plan - Monday Recap and Day Ahead🔄 Recap
Todays price action highlighted the power of technical analysis, with ES breaking out of a 4-month downtrend post-CPI, rallying 120 points. The market formed a bullish triangle pattern last week, which led to a breakout and an upward trajectory today, aligning perfectly with our analysis from the last newsletter.
📈 The Markets Overnight
🌏 Asia: Mixed
🌍 Europe: Down a bit
🌎 US Index Futures: Down
🛢 Crude Oil: Down
💵 Dollar: Down slightly
🧐 Yields: Down slightly
🔮 Crypto: Down
🌏 Major Global Catalysts
FOMC meeting minutes and NVDA earnings later today.
🔍 Key Structures
4622: Core trendline connecting the January 2022 COVID bull market high with the August 2022 high.
4577-80: A major resistance level observed in late August.
4543-35: A critical resistance level, now the most important zone to hold.
4521-18: A vital support level that has been crucial in the recent rally.
4488: An important zone for back-testing as the first major support down.
4445-47: A key back-test support level post-CPI day breakout.
📉 Support Levels
Major Supports: 4556-58, 4542, 4536-38, 4521, 4488, 4446-48, 4400-4405.
📈 Resistance Levels
Major Resistances: 4577-80, 4607-09, 4623, 4658.
📝 Trading Plan
Short-Term Focus: Watch 4536-38 for potential bearish indications.
Long-Term Strategy: Bulls remain in control; maintain focus on key supports for signs of sustained upward movement.
🔚 Wrap Up
As we approach Thanksgiving, typically strong for the market, we need to stay vigilant for potential shifts. The market's resilience with only one red day this month suggests strong bullish control, but caution is advised due to the holiday trading week and potential overhead supply.
Disclosure: This is not financial advice and is for informational purposes only. Please consult a professional financial advisor before making any investment decision.

ES Short ideaFirst position is a deviation of previous weekly high which I consider a key pivot. Confluence is a trend line break. Risk is defined. See how it goes.

SPY ANALYSIS 11/21Expecting a liquidity grab tomorrow at NY open - then a reversal for the rest of the week
