Sell and Buy ES MarketWeek prevision to sell on friday after that you have to buy market. Good Luck.
Micro E-mini S&P 500 Index Futures
No trades
Market insights

ES - November 13th - Daily Trade PlanNovember 13th- Daily Trade Plan - 5:18am
*Before reading this trade plan, IF, you did not read yesterdays, or the Weekly Trade Plan take the time to read it first! (You can see both posts in the related publication section) *
If my posts provide quality information that has helped you with your trading journey. Feel free to boost it for others to find and learn, also!
My daily trade plan and real-time notes that I post are intended for myself to easily be able to go back and review my plan and how I did from an execution perspective.
--------------------------------------------------------------------------------------------------------
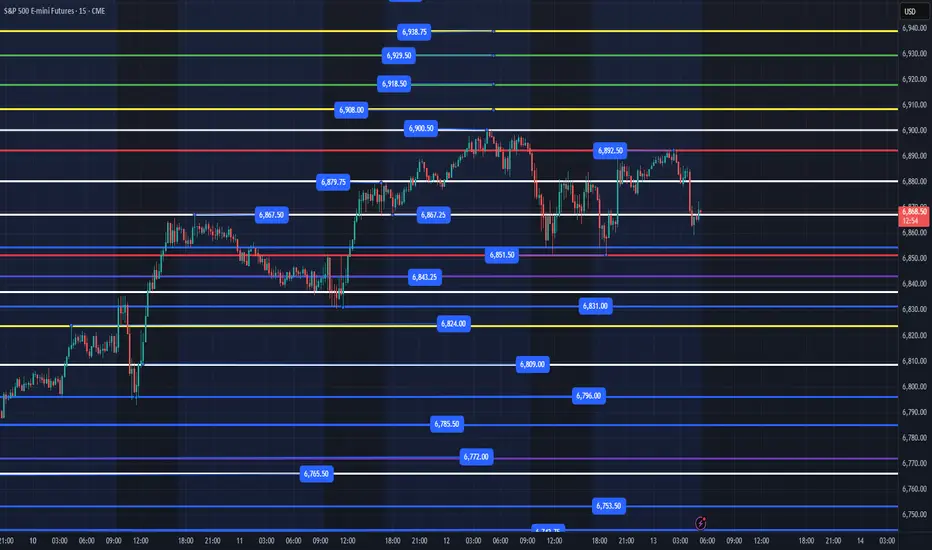
We have CPI at 8:30am and price action this week has been mainly contained to a range between 6831-6900. I expect us to have some volatility today and I am looking at only the best levels to flush and reclaim. Each day there are many levels that can bring points, but the highest quality levels are those where Institutions are entering to ride higher. 6867 has been a magnet inside our range.
Overnight high is 6892 and Overnight low is 6851. As I am typing this post, price just reclaimed 6867 and I anticipate it at least back testing the 6879 level which it broke down from this am.
Key Levels Today -
1. Loss of 6851-53 and reclaim
2. Loss of 6843 and reclaim
3. Loss of 6831 and reclaim
4. Loss of 6796 and reclaim
5. Loss of 6772 and reclaim (possibly as low as 6765 to close the gap)
6. Loss of 6743 and reclaim (possibly down to 6731)
Below those areas and we will most likely need to retest 6654. Price needs to clear 6900 to continue higher with 6918, 6929, 6938, 6953+ being the immediate targets higher.
Key Support Levels - 6867, 6851-53, 6843, 6831-36, 6824, 6809, 6796, 6785, 6772, 6765
Key Resistance Levels - 6879, 6893, 6900, 6908, 6918, 6929, 6938, 6953
We are in a tight range overnight and I still think we need to lose 6851-53 and reclaim for us to move above 6900. Ideally, we can flush down to 6824 and reclaim 6831 or 6837 and reclaim 6843. IF price is selling off, make sure to take your time on entering. Let price flush the level, back test that level, price hold, then you can enter.
I will post an update around 10am EST
----------------------------------------------------------------------------------------------------------------
Couple of things about how I color code my levels.
1. Purple shows the weekly Low
2. Red shows the current overnight session High/Low (time of post)
3. Blue shows the previous day's session Low (also other previous day's lows)
4. Yellow Levels are levels that show support and resistance levels of interest.
5. White Levels are previous day's session High/Low
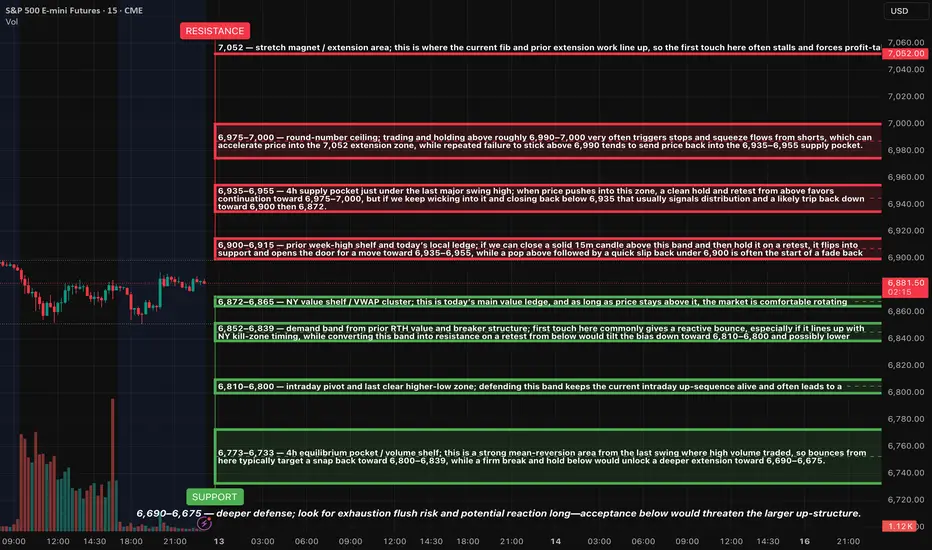
ES (SPX, SPY) Analysis, Levels, Setups for Thu (Nov 13th)HTF Analysis
Daily Chart: The overall trend remains bullish. Currently, the price is situated near the upper range, just below the previous swing high in the 6,960–6,980 zone. The market structure is characterized by a sequence of higher highs and higher lows, indicating that we are experiencing a temporary pause rather than a confirmed peak.
4-Hour Chart: We’re observing a robust V-shaped recovery from the 6,63x–6,66x support zone, with the price now consolidating sideways beneath overhead resistance. The recent 4-hour candles are overlapping within today’s range, suggesting a coiling pattern under resistance rather than a decisive breakout.
15-Minute to 30-Minute Charts: There’s a well-defined range forming. The highs are established around the 6,900–6,915 level, while the lows are consistently found between the 6,872–6,865 shelf, with further lower shelves below. Today's price action has effectively mapped out a framework for potential trading opportunities moving into tomorrow.
MACRO / EVENTS
The government shutdown has officially ended, and normal operations are resuming across agencies. This removes the associated headline risk. The market can now return its focus to the usual macroeconomic drivers: inflation data, the Federal Reserve's policy path, and corporate earnings.
However, there remains some uncertainty regarding the timing and form of upcoming inflation releases due to previous disruptions in data collection. The 8:30 AM ET time slot is still considered a potential source of market volatility. Aside from that, the economic calendar is relatively light, meaning that trading activity around our key levels will likely drive most of the intraday market movements.
SETUPS FOR TOMORROW (LEVEL–KZ STYLE)
Long setup 1 – bounce from 6,872–6,865
Idea: Look for Asia or London to probe into 6,872–6,865 and hold. If we see a clean rejection candle on 15m or 5m and then price reclaims 6,880 and holds above, that sets up a continuation long.
Trigger concept: Reclaim and hold above 6,880 after testing 6,872–6,865.
Risk anchor: Below 6,865, with a little room for noise depending on spread and volatility.
Initial target: 6,900–6,915.
Secondary target: 6,935–6,955.
Stretch idea: If 6,955 holds as new support and order flow remains strong, leave a small runner with eyes on 6,975–7,000.
Long setup 2 – deeper dip buy at 6,852–6,839 or 6,810–6,800
Idea: If 6,872–6,865 fails cleanly but overnight selling is controlled, watch for a fade into 6,852–6,839 or, in a stronger flush, 6,810–6,800. Look for exhaustion and quick reclaim of the upper edge of the band as a signal that buyers are stepping back in.
Trigger concept: Fast rejection wick through the band followed by a close back above the upper edge on 5m–15m.
Risk anchor: Below the lower edge of the chosen band (either under 6,839 or under 6,800).
Targets: First push back to 6,872–6,865, then 6,900–6,915 if momentum improves.
Short setup 1 – fade 6,900–6,915 pop-and-fail
Idea: If price rips into 6,900–6,915 during NY AM without first testing the lower shelves and then quickly fails to hold above 6,900, that is often a spot to fade the top of the range.
Trigger concept: Wick above 6,900–6,915 with a 5m–15m close back below 6,900.
Risk anchor: Above 6,915–6,920.
Initial target: 6,872–6,865.
Extended target: 6,852–6,839 if 6,872 cracks and holds below.
Short setup 2 – rejection from 6,935–6,955
Idea: If we get a clean breakout above 6,900–6,915 but the first test of 6,935–6,955 stalls with heavy wicks and no follow-through, you can look for a tactical fade of that 4h supply pocket.
Trigger concept: Failure to hold above 6,955, with a rotation back under 6,935 on a 15m close.
Risk anchor: Above 6,960–6,965.
Initial target: 6,900–6,915.
Secondary target: 6,872–6,865 if selling expands.
RISK NOTES
Avoid trading in the middle of the 6,872–6,865 and 6,900–6,915 band; let price push into the edges and then trade the reaction.
Size down if price is very slow and overlapping ahead of the 8:30 ET window; there is no need to swing full size into dead tape.
If you see a sudden spike around the data or headline window, focus first on how price behaves at the key shelves 6,872, 6,900, and 6,935 rather than trying to guess the news.
ES UpdateIndicators don't show much, which is why I haven't posted. I did get a day trade in on DIA Tuesday, I dumped it because YM1! was overbought, guess I should've held it overnight.
Good chance of a gap down tomorrow because FDAX is overbought. Also the gap below needs to fill.

S&P500: Slightly higherS&P 500 futures edged slightly higher in yesterday’s session. The index appears to remain within the upward trajectory of magenta wave (5), which is expected to continue pushing higher. Once this wave reaches its peak, the larger blue wave (III) should also complete. Afterward, we anticipate a corrective phase in the form of magenta wave (A), which could put renewed pressure on the index. However, if prices reverse course and fall below the support level at 6,371, our alternative scenario will come into play. In that case, alternative wave alt.(4) would likely extend further downward, targeting a low within the corresponding alternative zone between 6,055 and 5,822 points (probability: 30%).

Day 68 — Clean Entries, No Chasing | +$251 Trading S&P FuturesMade $251.50 today trading S&P Futures — a clean, low-stress day built around precision and patience.
I shorted the 6892 resistance zone early when structure flipped bearish, then sat out most of the chop until we got a confirmed X3 buy signal at 12:30 to go long.
Days like this are all about discipline — no chasing, no forcing, just letting structure and the algo do their job.
VX Algo was on point — 9 out of 10 signals worked for 5+ points.
That’s the kind of day where patience pays.
Tomorrow’s Levels
Above 6850 = bullish, below 6830 = bearish.
Expect a quieter range day unless we get major data or earnings surprises.

quick short then to NHdoji 1H, quick short then back to the top or maybe new highs.... keeping it simplee !!

Leap competition - The notional trade value for 1 contract Dear Traders,
Once again, we can measure where we are, how sharp we are in the market, and we can do this in a fun way. Participation is more important than the result, since this won’t be the last time we compete — and if we train, we have a chance to be better than before, especially if we analyze our mistakes after the competition.
As in every game, it’s important to know the rules and the values of different cards; therefore, I made a quick bar chart for you guys related to the allowed instruments in the current LEAP competition — notional values which can determine the size of your gains and losses.
The notional trade value for 1 contract of each. I used the official contract multipliers.
imgur.com

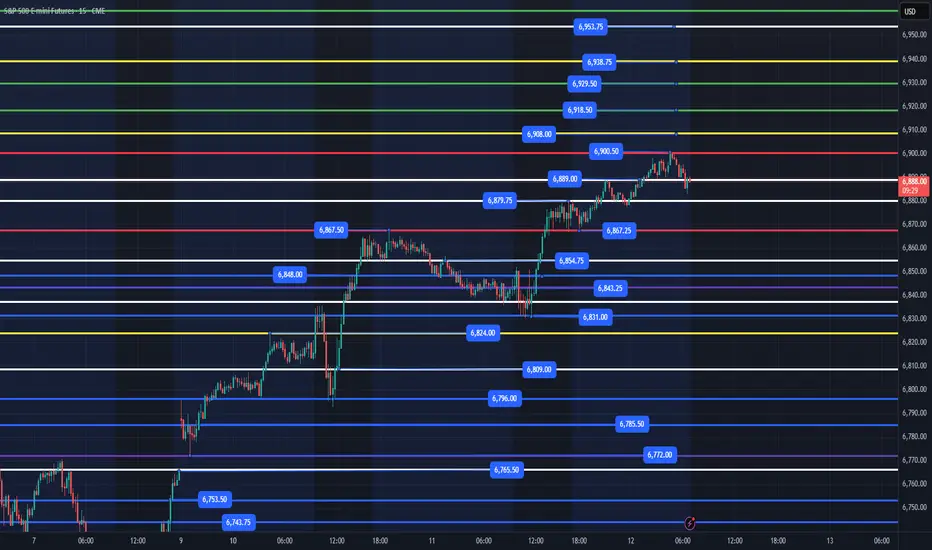
ES - November 12th - Daily Trade PlanNovember 12th- Daily Trade Plan - 6:50am
*Before reading this trade plan, IF, you did not read yesterdays, or the Weekly Trade Plan take the time to read it first! (You can see both posts in the related publication section) *
If my posts provide quality information that has helped you with your trading journey. Feel free to boost it for others to find and learn, also!
My daily trade plan and real-time notes that I post are intended for myself to easily be able to go back and review my plan and how I did from an execution perspective.
--------------------------------------------------------------------------------------------------------
Yesterday we lost the overnight low of 6836 down to 6830 level and reclaimed to move us higher in the afternoon and into the overnight session today. Yesterday's price action was very choppy, and a big battle was had at the daily low of 6831. This will become a good level next time we can test it and reclaim.
Overnight Low was 6867 and high is 6900. 6867 was yesterday's overnight high and we cleared it around 1pm, built a strong base and held it overnight. This level should be our first level to grab some points today. The RSI is extended on all time frames, and we have CPI & PPI coming up over the next couple of sessions which should give us some actionable volatility. The big question will be - Can we go to ATH's? I believe the re-opening of the government once it is officially through will create volatility and it could be a sell the event moment. If you remember, this current rally we are in started with a massive sell off on Friday that lost a prior weekly low at 6690 (Which is the level I had talked about being very important for us to hold to keep the uptrend going.) Institutions bought it up around noon on Friday down at 6654 and put in a massive squeeze. Then around 2pm that day news came out that Democrats had put a proposal on the table to open the government (Buy the News event). Moving forward over the coming weeks, the weekly low of 6654 will be critical to the uptrend and needs to hold again for us to continue higher.
Key Levels Today -
1. Loss of 6867 and reclaim
2. Loss of 6831 and reclaim
3. Loss of 6796 and reclaim
4. Loss of 6772 and reclaim (possibly as low as 6765 to close the gap)
5. Loss of 6743 and reclaim (possibly down to 6731)
Below those areas and we will most likely need to retest 6654. Price needs to clear 6900 to continue higher with 6918, 6929, 6938, 6953+ being the immediate targets higher.
Key Support Levels - 6889, 6879, 6867, 6854, 6848, 6831-36, 6824, 6809, 6796, 6772, 6765
Key Resistance Levels - 6900, 6908, 6918, 6929, 6938, 6953
We are in a tight range overnight and I still think we need to lose 6867 and reclaim for us to move above 6900. We could easily lose 6889 or 6879 and reclaim to move higher, but those are very micro reclaim levels that I do not like to engage as most liquidity (stops) should be below 6867.
I will post an update around 10am EST
----------------------------------------------------------------------------------------------------------------
Couple of things about how I color code my levels.
1. Purple shows the weekly Low
2. Red shows the current overnight session High/Low (time of post)
3. Blue shows the previous day's session Low (also other previous day's lows)
4. Yellow Levels are levels that show support and resistance levels of interest.
5. White Levels are previous day's session High/Low
Futures electronic hoursFutures electronic hours
💡 This idea focuses on trading futures during the electronic trading hours — the periods outside the regular cash session, where unique price behavior often occurs due to lower liquidity and algorithmic dominance.
📊 Core Strategy:
During electronic hours (typically post-market/pre-market), futures like ES, NQ, or CL often show sharp moves driven by global macro news, low-volume liquidity zones, or overnight positioning. These moves can offer high-probability setups when combined with key levels from the regular session.

I Made $977 Trading S&P Futures | Day 67 Market BreakdownI made $977 today trading S&P Futures, catching both sides of the move — shorting early weakness, then flipping long after a confirmed bullish structure shift.
The VX Algo signals lined up perfectly with the government shutdown resolution, giving clear reads on momentum reversals. Patience, structure, and signal confirmation were key today.
Above 6830 stays bullish, below 6807 turns bearish.
Watch for structure continuation into midweek.

ES (SPX, SPY) Analysis, Levels, Setups for Wed (Nov 12)Price closed near the prior week’s highs after a clear four-hour impulsive leg from last Friday’s low. Momentum appears constructive while the 15-minute swing structure holds higher lows above the New York value shelf.
Setups:
Play A — Acceptance Long: Wait for a 15m full-body close ≥6,900 and a 5m pullback that holds ≥6,892–6,895. Enter on a 1m HL reclaim. Hard SL = 15m trigger-wick low minus 0.25–0.50. TP1 6,915. TP2 6,935. TP3 6,955–6,975. Viability gate: TP1 must be ≥2.0R versus the 15m stop.
Play B — Rejection Fade: If 6,900–6,915 rejects with a 15m close back inside ≤6,889, enter on a 5m re-close lower and a 1m LH. Hard SL = 6,905–6,912 (above rejection wick). TP1 6,872. TP2 6,852. TP3 6,839→6,810 if momentum accelerates.
Bias & Invalidation: Bias is mildly bullish while 6,865–6,872 holds on 15m closes. Bias flips neutral-to-bearish on decisive 15m body-through below 6,839.
Kill-Zones (ET): NY AM 09:30–11:00 for entries. Manage through Lunch. NY PM 13:30–16:00 for follow-through or fades into exhaustion.
News & Events (tomorrow): No CPI risk on the docket. Watch the U.S. 10-Year Note auction around 13:00 ET and headline risk from the OPEC and IEA monthly oil reports in the morning; both can sway rates and index tone.

A shift away from tech stocksThe price action in the daily chart of the S&P 500 implies a potential shift away from tech stocks. Capital is still in the stock sector the structure implies this potential capital shift.

ETF ScannerGabriel’s ETF — Institutional Performance & Efficiency Screener
Description:
Gabriel’s ETF screener isolates high-efficiency, institutional-grade exchange-traded funds (ETFs) that combine superior long-term performance with low structural drag.
It’s designed to uncover funds that outperform peers through strong 5-year returns, consistent NAV growth, low expense ratios, and disciplined yield management — essentially finding the “alpha carriers” of the ETF world.
This screener serves as both a portfolio foundation builder and a benchmark comparison tool for systematic investors, portfolio managers, and capital allocators.
Scanner: www.tradingview.com
⚙️ Interpretation: Strategy Intent
The set is effectively constructing a “Quality Growth + Liquidity + Efficiency” model, targeting:
Consistent long-term compounding (≥ 30 % 5Y Perf)
Healthy recent trend (≥ 10 % 1Y NAV Return)
Low-cost structure (≤ 0.4 %)
Institutional-grade liquidity (≥ 2 B AUM + ≥ 900 M USD volume)
Dividend reliability (≥ 0.45 %)
Moderate volatility (ADR < 1.55 %)
This combination favors stable, mega-cap ETFs suitable for core allocation portfolios or All-Weather ETF models.
📊 Expected Results
With these filters, your screener will likely highlight ETFs such as:
SPY / VOO / IVV – Core S&P 500 index trackers with large AUM, strong 5-year performance, low fees.
QQQ / VGT / XLK – Tech-heavy growth ETFs with > 30 % 5-year gains.
SCHD / VYM / HDV – Dividend-weighted funds meeting your minimum yield and efficiency filter.
XLF / XLI / XLE / XLV / XLK – Sector ETFs with institutional liquidity.
IWF / IWD / RSP – Style-based or equal-weight funds passing both momentum and liquidity screens.

S&P500 ON IT'S WAY TO TEST ALL TIME HIGH!Hey Traders so we are back in action checking out the Stock Indexes again.
From now on my main focus will only be the indexes I feel they are the best markets to trade for trend followers like me. Although I may occasionally make a post about other markets the indexes are my main area of study so with that being said lets dive in!
So Govt Shutdown? Seasonally Strength? Inflation Fears? Interest Rates Cuts/Hikes?
I say if you read all the headlines you will find your self in a whirlwind of ideas of how you could trade this market. But imo forget the headlines and go to what we can trust in my opinion is the charts!
For me I believe trade what I see not what we think, not what we hear, only focus on what we see the charts always have been and always will be at least for me the best guide on how to sail these uncharted waters so what do we actually see?
Well I se a strong uprtrend in place since April and I also see the market has rejected the 6690 level 3 times that tells me without any indicators needed what so ever that the market does not want to move lower than that level for now.
Support and Resistance is all you need imo to see whats happening every trading day tells a story follow the story and you will hopefully get on the right side of the market.
So therefore scenarios for today are...
Bullish- this is market is a buy imo on a pullback to the trendline around 6813. Try to put a stop somewhere out of harms way but give the market breathing room around 6760 ish looks safe. Also November seasonally is a strong month normally for stocks. If the Shutdown ends the market could celebrate and the move could be epic!
Bearish- stay in hibernation for the winter. 😁
No seriously the odds and the probabilites are really against the bears here. I would wait for January where normally market Seasonally weakens till march. Watch for maybe a top or break below support and a break below the trendline on a daily close to be sure. Then consider selling a rally.
Commitment of Traders- no report at this time due to govnt shutdown.
Good Luck & Always use Risk Management!
(Just in we are wrong in our analysis most experts recommend never to risk more than 2% of your account equity on any given trade.)
Hope This Helps Your Trading 😃
Clifford
RISK DISCLOSURE
TRADING IN THE FUTURES AND FOREX MARKET INVOLVES SIGNIFICANT RISK. ALWAYS CONSULT A FINANCIAL ADVISOR AS HIGH RISK ASSET CLASSES MAY NOT BE SUITABLE FOR ALL INVESTORS. THIS IS NOT A RECOMMENDATION TO BUY OR SELL ANY ASSETS. ALL IDEAS ARE MADE FOR EDUCATIONAL PURPOSES. PAST PERFORMANCE DOES NOT GUARANTEE FUTURE RESULTS.
CFTC RULE 4.41 – HYPOTHETICAL OR SIMULATED PERFORMANCE RESULTS HAVE CERTAIN LIMITATIONS. UNLIKE AN ACTUAL PERFORMANCE RECORD, SIMULATED RESULTS DO NOT REPRESENT ACTUAL TRADING.

ES - November 11th - Daily Trade PlanNovember 11th- Daily Trade Plan - 8:45am
*Before reading this trade plan, IF, you did not read yesterdays, or the Weekly Trade Plan take the time to read it first! (You can see both posts in the related publication section) *
If my posts provide quality information that has helped you with your trading journey. Feel free to boost it for others to find and learn, also!
My daily trade plan and real-time notes that I post are intended for myself to easily be able to go back and review my plan and how I did from an execution perspective.
--------------------------------------------------------------------------------------------------------
I was off my desk yesterday and I am now catching up for this week.
Overnight Low is 6836 and the Overnight High is 6867. We have been moving sideways since 1pm yesterday in this range and we must respect the short-term trend that is bullish. We still have the 6765-level gap that needs to be filled at some point. We have CPI & PPI this week, so I do expect some volatility.
Key Levels Today -
1. Loss of 6836 and reclaim
2. Loss of 6796 and reclaim
3. Loss of 6772 and reclaim (possibly as low as 6765 to close the gap)
4. Loss of 6743 and reclaim (possibly down to 6731)
Below those areas and we will most likely need to retest 6654. Price needs to clear 6878 to continue higher and change the macro trend.
Key Support Levels - 6836, 6824, 6809, 6796, 6772, 6765, 6753, 6743, 6731, 6710, 6695
Key Resistance Levels - 6854, 6867, 6885, 6893, 6908
We are in a tricky spot as you have short term resistance at 6847 then 6854 and 6867. Ideally, we can lose 6836 down to 6824, 6809 and then reclaim those levels to move higher.
I will post an update around 10am EST
----------------------------------------------------------------------------------------------------------------
Couple of things about how I color code my levels.
1. Purple shows the weekly Low
2. Red shows the current overnight session High/Low (time of post)
3. Blue shows the previous day's session Low (also other previous day's lows)
4. Yellow Levels are levels that show support and resistance levels of interest.
5. White Levels are previous days session High/Low

Greedy Short Gone Wrong | Day 66 Trading S&P FuturesI started the day strong, shorting the 6830 resistance level for quick profits — but got greedy and went for more at 6852, thinking the market couldn’t push higher.
It did. I got squeezed, gave back all my gains, and ended the day basically flat.
Some days remind you: the market doesn’t owe you anything.
VX Algo had 4 out of 5 clean signals today — structure nailed the direction early.
Tomorrow’s levels: Above 6810 bullish, below 6780 bearish.

Follow through to the upside is expectedFollow through to the upside is expected for the daily chart of the S&P 500. The next objective to the upside 6885.

Do you get Deja vu?Some say that history is repeating itself according to the dot-com bubble and the nifty fifty crash that led to a dark period in the US market. Why are we scared that the same situation will happen again? For starters, The Mag 7 who is consisted of the seven biggest company of the S&P 500 have a combined market cap of 22 trillion, which mean around 35-37% of the whole index… In fact, the same thing happened before the dot-com crash and the nifty fifty catastrophe. They were traded 40 times their valuations, so the price-to-earning ratio wasn’t considered healthy. Plus the biggest companies in the Nifty fifty composed of around 25% of the entire S&P.
But… The dot-com crash was a lot due to many start up being invested in and not giving the merchandise they should’ve, leading to many bankruptcy. The Nifty fifty was composed of businesses that people thought were untouchable, like McDonald’s, Coca-Cola, Polaroid, Disney and more. A bunch of people invested blindly in those businesses thinking they’ll just never stop growing… but those company could not innovate anymore. So once they showed lower than expected gains months after months they couldn't do anything else than watch people leaving with the pedal to the metal which led to atrocious losses.
Now, do we have the same pattern? It is true that the Mag7 is taking a huge chunk of the S&P, as they should, but can we anticipate a sell off?
If you analyze the facts; Businesses invest billions day after day into AI companies who can boost their platform and propel them in front of the innovation race. We can’t stop being amazed by every giant step they take in AI automatization and in the progress of the LLMs. Months after months those companies innovate and give back to their investor an excellent ROI. They expand and try to see what’s gonna be the next best thing and come out on top. Tech is not the same as those nifty fifty and dot com businesses who were over traded (which is a misconception, cause the Mag7 is also “over traded” but it is just a indicator of high liquidity and investor interest not necessarily an imbalance in their whole market value.) But i still mention it cause it is a an argument many people employ.
So ask yourself: is what’s happening with AI the same as the nifty fifty or the dot-com bubble, or did AI just took the S&P, those Mag7 companies or should i just say the world to an other level?
I guess only time will tell, till then,
Your friendly day trader,
Esteban.

ES (SPX, SPY) Analysis, Key Levels, Setups for (Nov 11th)S (Dec) Plan for Tue, Nov 11 — Level-KZ Protocol (15/5/1).
Bias is constructive while trading above the 6,838–6,845 range; the first test into 6,880–6,900 serves as a decision point. Thinner liquidity is expected around the U.S. holiday, so execute trades only within NY kill zones.
Setups (trade the level → next level; 15m→5m→1m sequence)
Long — Bounce at 6,838–6,845: sweep/quick-reclaim → 5m re-close → 1m HL entry. Hard SL below 6,830 wick. TP1 6,872–6,880, TP2 6,900, TP3 6,930. Viability gate: TP1 ≥ 2.0R.
Long — Acceptance above 6,900: full 15m body close >6,900 → hold the retest → 1m HL. SL below trigger wick. TP1 6,930, TP2 6,955–6,970, runner eyes weak-high cleanup.
Short — Rejection fade 6,900–6,930: wick through → 15m close back below 6,895 → 5m LH. SL above session high. TP1 6,872, TP2 6,845, TP3 6,805; lose 6,805 and momentum can slide toward 6,770 then 6,733.
News & session conditions (ET)
U.S. Veterans Day — equities open; U.S. bond market closed; U.S. macro slate is light. Overnight focus: NZ inflation expectations (evening ET), U.K. Labour Market (pre-London), Germany ZEW (pre-NY). Expect patchy liquidity around the holiday; be strict with the 2R viability gate and trade only inside NY AM/PM kill-zones.

S&P 500 (ES1!): Is This The Dip We Were Waiting For? Yes!Welcome back to the Weekly Forex Forecast or the week of Nov. 10-14th.
In this video, we will analyze the following FX market: S&P 500 (ES1!)
The S&P500 is respecting the Weekly +FVG... barely! Friday's rally may indicate the pullback is over and the resumption of the bullish momentum is upon us.
Look for valid buy setups only! Sells are not valid unless there is a bearish break of structure!
Enjoy!
May profits be upon you.
Leave any questions or comments in the comment section.
I appreciate any feedback from my viewers!
Like and/or subscribe if you want more accurate analysis.
Thank you so much.
Disclaimer:
I do not provide personal investment advice and I am not a qualified licensed investment advisor.
All information found here, including any ideas, opinions, views, predictions, forecasts, commentaries, suggestions, expressed or implied herein, are for informational, entertainment or educational purposes only and should not be construed as personal investment advice. While the information provided is believed to be accurate, it may include errors or inaccuracies.
I will not and cannot be held liable for any actions you take as a result of anything you read here.
Conduct your own due diligence, or consult a licensed financial advisor or broker before making any and all investment decisions. Any investments, trades, speculations, or decisions made on the basis of any information found on this channel, expressed or implied herein, are committed at your own risk, financial or otherwise.

ES UpdateTrying to break through the resistance line, not sure what's gonna happen tonight.
Open gap always makes me bearish, so I did not go long again after I dumped my calls on open. Just waiting for MFI to get overbought so I can buy puts. Guessing that will happen by Wed open.
Not sure why foreign markets gapped up because of the shutdown ending, and the market didn't tank because of the shutdown so there's really no reason for it to rally now that it's ending..... so I'm expecting a pump and dump.
Sorry, no arrows today.

ES1 technical trade ideas for this week11/10/25-ES1 technical trade ideas for this week11/10/25
well be looking forward to a short pull back in the 6900-6920 range has a high selling pressure in those lv
