1H FVGToday we aim for the FVG in one hour. Just be careful that at 02:00 pm New York local time we have the FOMC. The FOMC affects the market and there is a possibility that the market will not respect the applied strategy.
MNQZ2021 trade ideas

E-Mini Nasdaq AnalysisHi folks. I'm back with the analysis for the E-Mini. Today we are bullish. After he takes the sellside part, wait for him to make a break in the market structure and enter the trade. For those who trade CAD, at 08:30 you have high impact CPI news. Be careful and take care

Another updateAfter taking this high, the market will more than likely retrace. Be patient and we will see. I will keep you posted. We have the FOMC and the market is not precise.

I updated today's analysisI updated today's analysis. It seems that the market has other plans. I will see after he takes the part of the buyside if he withdraws. And I will look for a sell entry.

Selling Nasdaq sharesSell NASDAQ shares as described in the analysis provided and follow the steps specified in Stop Loss and Take Profit

Today's analysis E-MiniFor those who still think that trading is a scam, check my profile for more information. Today we are bullish. After analyzing the DXY, I noticed that on the daily it reached a gap from which it will reverse. At 9:00 am new york local time we have the FOMC. News of medium impact news. I will keep you informed if changes are announced

NQ1! BEST PLACE TO SELL FROM|SHORT
Hello,Friends!
The BB upper band is nearby so NQ1! is in the overbought territory. Thus, despite the uptrend on the 1W timeframe I think that we will see a bearish reaction from the resistance line above and a move down towards the target at around 17922.50.
✅LIKE AND COMMENT MY IDEAS✅

Week of May 19 - NDX/VIX/10y/OilNew record highs on indexes!!
The DJI broker 40k, and CME_MINI:NQ1! itself broke to nATH as well. CBOT_MINI:YM1! never actually made a nATH, but cash DJ:DJI did - so I wan waiting for that to resolve itself.
The good news is that CME_MINI:NQ1! has a really clean weekly chart here, so I will be focusing on that this week instead of the Dow.
I think we are entering the final blow-off phase of the markets where we could see a final up leg that takes us vertical to 50k on the Dow, 7k on SPX, and 22k on NDX. That said - I still see Q4 as being super weak, but the market wants to go higher and it will get its wish with the VIX and bond market helping along - but I will cover that later.
Nasdaq
Last week, we made a nATH which is great. From HERE - I want to see a pullback on CME_MINI:NQ1! to around $18k. This is a weekly FVG as well as ~50% pullback from the ATH. This will also satisfy our ERL -> IRL move.
Once we take that out, we can see a weekly Fib projection of 19.6k - and at that point I think they would just muscle this thing to 20k.
VIX
Our poor baby TVC:VIX - what have they done to you!? Friday was OPEX so I was expecting to see them pin price somewhere as they drained the VIX dry - and thats exactly what they did.
VIX nLOY - and we almost swept the 2023 lows which is a 4 year low. The TRAP in all of this - is that I do NOT want to be looking for Longs with a VIX that is at multi-year lows. I want the VIX to pop to help pressure indexes for a normal pullback. The faster the pullback and the higher the VIX - the sooner we can get on with this final leg of a 40 year bull market.
Bonds
I have been watching the 10yr note really closely as it looks like rates are going to backtest higher before resuming lower. A slight backup in rates, along with a VIX pop, SHOULD give us the needed pressure on indexes to get a proper pullback to buy. The longer term picture is still much lower for rates from here as the economy continues to weaken. Stocks won't care WHY rates are dropping - at least not for a while.
So long as we have a low-ish VIX, and bonds are bid - the indexes (especially tech) will FLY higher.
Oil
Oil FINALLY gave us some weekly context we can start leaning against. Oil is starting to march lower and this week was just the pullback into a weekly IRL level. From HERE, I want to see Oil continue to march lower on the weekly. This will continue to ease inflation - which will drop rates - which will bid bonds - which will allow indexes to FLY. Everything is starting to align for a final leg up in a parabolic - exactly what David Hunter has been talking about.
So here is the setup I am watching for this week;
I am looking for indexes to start a pullback this week led by NQ. Any pullback I expect to be fast and sharp - so that nobody can capitalize on it. Set your alerts - I am looking for ~ 18k on NQ1!
I want to see the 10yr sweep the highs of last week, and then continue to march lower. This added pressure from the Bond market will weight on indexes.
I want to see oil start a march lower from here. The next weekly target for me is down around 75.6
Until next week - We'll be watching.


Taking what it offers meWe reflected on the market and today we are bearish. We only have one medium impact news at 10:15am New York local time. Be careful that today is Friday and usually on Monday and Friday the market is not as precise and does not always respect the strategy you want to apply.

Looking for sells1. Imbalance below
2. 4hr bearish (tpd twice)
3. 1hr bearish (tpd twice)
4. 45min FSH
5. 30min SSl

Today's analysisI want to inform you that after doing the analysis, today we are bearish. It is important to take care that at 08:30 we have high impact news. The analysis may change depending on what happens after the news. Pay attention and be careful.

Change of analysis due to newsConsidering that at 08:30 we had high impact news, we predicted that the market would go down, but it seems that it did not form a fvg that would give us an entry into the sell. That's why I will wait for him to take the part of sellside liquidity and I will go long. That is why it is difficult to have a precise analysis on the day when you have high impact news. I will keep you posted. Take care and be careful

NQ1!, big pictureAs NQ1! price moves towards its ATH at 18709, and assuming that new ATHs are found shortly, I'm looking at this being wave 5 of (3) of ((5)). Wave (1) of ((5)) was an expanding leading diagonal.
Major corrections in the primary wave structure coincide with significant world events (i.e. Great Financial Crisis, COVID-19, etc.). S&P, DJI, and Russell 2000 all at similar points in their wave structures, although I find the Nasdaq to provide the most clarity at this point.
I suspect wave (5) of ((5)) will complete within the next 12 months.


NQ Line In the SandE-mini S&P (June) / E-mini NQ (June)
S&P, yesterday’s close: Settled at 5324.75, up 3.25
NQ, yesterday’s close: Settled at 18,940.50, 64.50
E-mini S&P and E-mini NQ futures are on their backfoot ahead of the opening bell. As I mentioned in my evening video last night, breadth is at the front of my mind as it has been deteriorating significantly. Without NVDA these two major indices would have already eroded much more. Look no further than the E-mini Dow, which has no true NVDA exposure, trading more than 3.5% from its local high last Tuesday.
Yields are another concern, as the U.S. 10-year is now above 4.5%, the highest since the Friday May 3rd Nonfarm Payroll report. Also, according to the CME Group’s FedWatch Tool, the odds of more than one rate cut this year have dropped to 35.9% from 49.5% one week ago.
Although we are cautious, and I popped on the CNBC Halftime Report to update viewers with a hedge position on Friday, the trend is undoubtedly still bullish. Therefore, we will continue to hold a slight Bullish Bias as detailed below. However, we are watching yesterday’s intraday low in the E-mini S&P of 5296.75 very closely, and continued action below here will likely encourage added selling. If this is the case, a break below last week’s low and, furthermore, major three-star support at 5260-5264 will Neutralize this Bias in the near-term. Additionally, last Thursday’s settlement in the E-mini NQ, the big reversal day post-NVDA earnings, was 18,696.25 and aligns with the previous record high on March 8th and March 21st as major three-star support. We view a violation and close below here, as well as rare major four-star support at 18,620-18,635, as a negative and clear break of the bullish trend.
Bias: Neutral/Bullish
Resistance: 5304.50-5309.75***, 5316-5317.25**, 5324.75-5326***, 5329.25-5331.25***
Pivot: 5296.75
Support: 5285.25-5289.75***, 5273.50-5275**, 5260-5264***, 5241.50**, 5213.50-5216.75***, 5202.25-5204.25***
NQ (June)
Resistance: 18,919-18,946***, 18,977-18,982***, 19,023*, 19,085***, 19,319***
Pivot: 18,819-18,839
Support: 18,775-18,787*, 18,732-18,750**, 18,684-18,709***, 18,620-18,635****, 18,545-18,547**, 18,415-18,485***, 18,336.25-18,348**, 18,266,25-18,293***
Micro Bitcoin (May)
Yesterday’s close: Settled at 68,455, down 1,020
Bias: Neutral/Bullish
Resistance: 68,930-69,575***, 70,280-70,435**, 70,840-71,000***, 72,340-72,570
Pivot: 68,250
Support: 67,100-67,585**, 66,280-66,535****, 65,445**, 64,622-64,865***, 61,835-62,801***
*Trade ideas cited above are for illustration only, as an integral part of a case study to demonstrate the fundamental concepts in risk management under the market scenarios being discussed. They shall not be construed as investment recommendations or advice. Nor are they used to promote any specific products, or services.
Futures trading involves substantial risk of loss and may not be suitable for all investors. Trading advice is based on information taken from trade and statistical services and other sources Blue Line Futures, LLC believes are reliable. We do not guarantee that such information is accurate or complete and it should not be relied upon as such. Trading advice reflects our good faith judgment at a specific time and is subject to change without notice. There is no guarantee that the advice we give will result in profitable trades. All trading decisions will be made by the account holder. Past performance is not necessarily indicative of future results.

nasdaq FUN TIME2 possible trades.
long and short.
target in green.
description on the chart.
have fun
Elektra 33

NQ Power Range Report with FIB Ext - 5/29/2024 SessionCME_MINI:NQM2024
- PR High: 18951.00
- PR Low: 18936.75
- NZ Spread: 31.75
No significant calendar events
Fading inside prev session range.
- Hold prev week's highs
Evening Stats (As of 12:05 AM)
- Weekend Gap: N/A
- Gap 10/30/23 +0.47% (open < 14272)
- Session Open ATR: 227.10
- Volume: 20K
- Open Int: 249K
- Trend Grade: Bull
- From BA ATH: -0.7% (Rounded)
Key Levels (Rounded - Think of these as ranges)
- Long: 19246
- Mid: 18106
- Short: 17533
Keep in mind this is not speculation or a prediction. Only a report of the Power Range with Fib extensions for target hunting. Do your DD! You determine your risk tolerance. You are fully capable of making your own decisions.
BA: Back Adjusted
BuZ/BeZ: Bull Zone / Bear Zone
NZ: Neutral Zone

posted a bit late but short on nas100looking for a short on nas after the break out downwards from my trend line I marked.


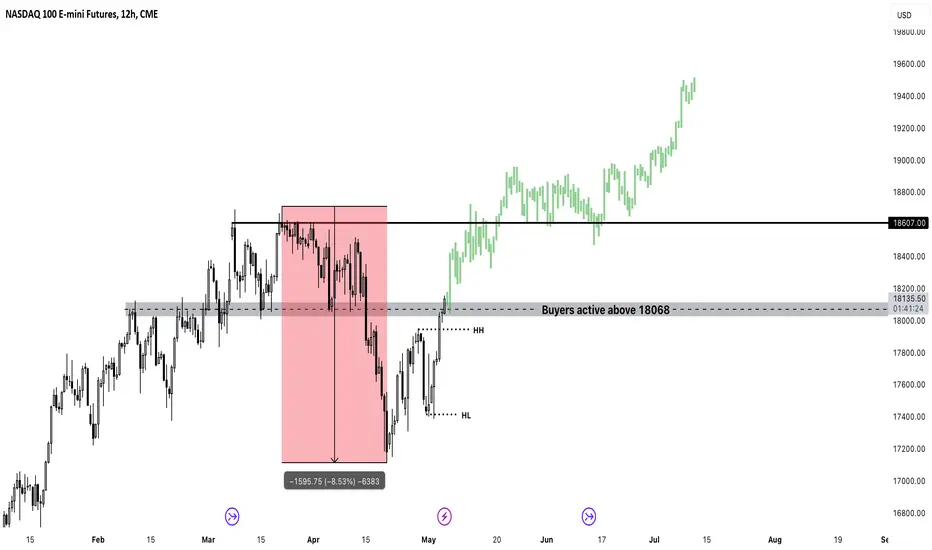
NASDAQ Uptrend Continuation Nasdaq 100 has fallen by 8.53% since its previous high.
The market has now created a new higher high and higher low signalling strong bullish momentum. If price can stabilise above 18608, we can see price target all time highs.

Long MNQAlgo says go long with a possible 2 entry if SL is hit. I may be taking profit at 50% target
