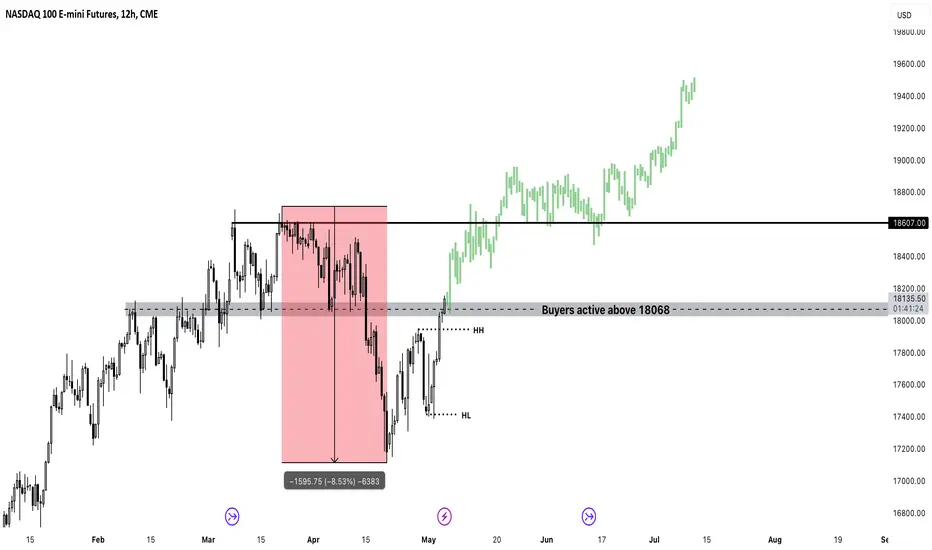
NASDAQ Uptrend Continuation Nasdaq 100 has fallen by 8.53% since its previous high.
The market has now created a new higher high and higher low signalling strong bullish momentum. If price can stabilise above 18608, we can see price target all time highs.
MNQZ2020 trade ideas
Slapping upper channel resistancePrice has reached upper resistance with MACD divergence.
If price breaks the fast MA and most recent pivot low -- taking a short to at least the median line.

ICT Mentorship 2022 Chart AnalysisUsing the attack plan of ICT mentorship 2022, after today's analysis the market would be bearish due to the gap on the daily. after we took the buyside liquidity area, we waited for a break in the market structure and after that we should look for a gap where we will execute the trade.

NQ: Minuette (b).Little trade idea. Seems like with the messy price action we have seen over the past couple of days, Equities might be reprimanded with one more trip down below to clarify for participants, does the market want a real rally, or just pump and chop dump fest. Irregularities dominated the price action in many assets I track this past week, but really, NQ has maintained, best of all, as if traders are seeking clarity over uncertainty. All magnitude would be well accounted for with an impulse down to the 17258 area, and a rally would be all but certain to follow...possibly even to retest the highs, or better, make new highs if this correction is complete. I am actually tracking this correction as THE correction, and cycle and primary waves appear in the chart as white and red, respectively. Time will tell where we end up, but for now, down, up, up, up, would be the action that I expect.

NQ Power Range Report with FIB Ext - 5/6/2024 SessionCME_MINI:NQM2024
- PR High: 18063.25
- PR Low: 18025.75
- NZ Spread: 84.0
No significant economic events
Low vol start to the week
- Holding inside Friday's highs
Evening Stats (As of 12:05 AM)
- Weekend Gap: N/A
- Gap 10/30 +0.47% (open < 14272)
- Session Open ATR: 309.44
- Volume: 17K
- Open Int: 237K
- Trend Grade: Bull
- From BA ATH: -3.7% (Rounded)
Key Levels (Rounded - Think of these as ranges)
- Long: 18675
- Mid: 18106
- Short: 16963
Keep in mind this is not speculation or a prediction. Only a report of the Power Range with Fib extensions for target hunting. Do your DD! You determine your risk tolerance. You are fully capable of making your own decisions.
BA: Back Adjusted
BuZ/BeZ: Bull Zone / Bear Zone
NZ: Neutral Zone

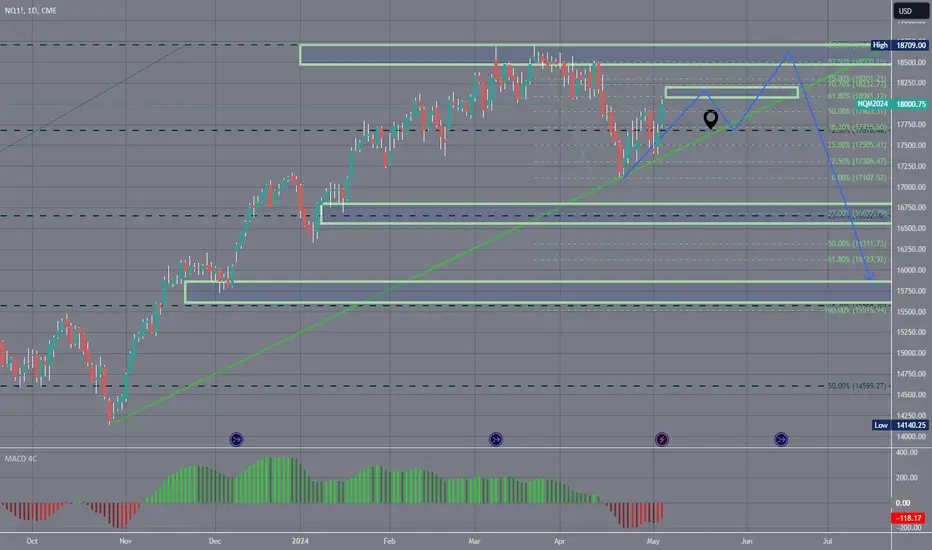
Bearish Looking for rebalance of price if price respects weekly resistance.
Broke trend on the weekly chart and now currently filling daily imbalances to the upside.
I am looking for lower prices by the end of may and mid june. for Q3 to be bearish.
Macros news:
Inflation Concerns: Inflation rates have been a major focus globally. Central banks in various countries are closely monitoring inflation data and adjusting monetary policies accordingly. Rising inflation can affect consumer purchasing power, interest rates, and investment decisions.
Supply Chain Disruptions: The pandemic-induced supply chain disruptions continue to affect economies worldwide. Shortages of raw materials, semiconductors, and other essential goods impact production and lead to higher prices.
Energy Prices: The surge in energy prices, including oil and natural gas, has implications for both consumers and businesses. Geopolitical tensions and supply constraints contribute to volatility in energy markets.
Currency Movements: Exchange rates fluctuate due to economic conditions, interest rate differentials, and geopolitical events. A stronger currency can impact exports, while a weaker currency may boost tourism and certain industries.
Geopolitical Risks: Tensions between countries, trade disputes, and geopolitical events (such as conflicts or sanctions) can create uncertainty in financial markets. Investors closely watch developments in regions like the Middle East, Asia, and Europe.
Central Bank Policies: The actions of central banks, such as the U.S. Federal Reserve, the European Central Bank, and the Bank of Japan, significantly influence global markets. Interest rate decisions and quantitative easing programs impact investor sentiment.


NQ in Daily FVG. Now We Wait On More Information#NQ weekly outlook 👀 5/5/24
(overall need more information to be confident in the direction)

NQ in Daily FVG. Now We Wait On More Information#NQ weekly outlook 👀 5/5/24
(overall need more information to be confident in the direction)

NQ1! SHORT FROM RESISTANCE
Hello,Friends!
NQ1! is trending down which is evident from the red colour of the previous weekly candle. However, the price has locally surged into the overbought territory. Which can be told from its proximity to the BB upper band. Which presents a great trend following opportunity for a short trade from the resistance line above towards the demand level of 17654.00.
✅LIKE AND COMMENT MY IDEAS✅

NQ PRICE PREDICTIONnot true unless it is false, price prediction is all bade on the change of character followed by liquidity sweeps and buy side orderblocks, main expectancy is to sweep previous highs. sell side order blocks reversing to buy side smc/ict mix

My personal analysis NQ for this upcoming week.NQ, along with other indices have been in a recent bullish run because of recent economic data and earning reports from the FOMC and the most impactful companies in the United States right now.
In the beginning of this past week, NQ has had a strong dump with price levels falling nearly 500 points (17900 to 17400) after a brief moment of consolidation. After further release of the interest rate decision, and a .1% increase in the unemployment rate, NQ exhibited a nice pump breaking through the previous high, justified by the many influential factors in the economy.
Now that in this upcoming week there isn't much major economic data to continue fueling the pump, I believe there will be another strong reversal after possible consolidation targeting levels around 17500, and I will be shorting soon after I see key levels broken.
I haven't looked into any anticipated earning reports that give more confirmation for either bias, but I will check those factors soon.
I am open to any critique in my analysis, any disagreements, and even confirmations. I am here to learn and grow along with everyone else.

13 October 23 this move started at 10484.75 peaked 8 March 2413 October 2023 this move started at 10484.75 and peaked on 8 March 2024 at 18709.
The AI mania and perceived Fed 7/8 cuts took hold of the market. But even now that the potential for the 7/8 cuts have evaporated into maybe 0/2 the market continues to press higher. No meaningful correction has been seen, and after this week it's possible that we extend to the highs again before we see the possibility of a decent correction
waiting monday 04/05 for NASDAQ responseHello ! Here is my setup for the next week on Nasdaq. Main trend is very bullish, but as you can see, there is a bearish short trend. Also, this flag is a continuous trend pattern, that's mean I'm more waiting for a bearish move. So first signal we have is this RSI print, next signal for enter in a short is a rejection of the price on this level (2 TP). If he break this line by the top, I have 2 options, if I see a long setup then I will go for it, but if the market don't show volatility I'm going to be disciplined and do nothing.

Nasdaq 100 Peak 2024 ?Will the 2021 peak happen again ?
consolidation occurs like in 2021, will history repeat itself?

Forecast bullish for MNQ on week #18I think MNQ will have a retracement at the beginning of the week to the zone I marked up between monday and tuesday and after that it could be mainly bullish for the rest of the week until hits the upper zone around 18100


NQ1!The NASDAQ 100 index is currently indicating a sell zone with its value at 17988.00 Traders may consider taking profit at various levels, such as 17,872.42, 17,700.00, and 17,601.18, as these points represent potential profit-taking opportunities. Additionally, it's prudent to set a stop loss at 18,861.78 to mitigate potential losses in case the market moves against the position. Monitoring these levels and adhering to a well-defined trading plan can help traders navigate the market with confidence and discipline.

NQ W/D Analysiswatching the willingness for NQ to break April 19 low.
Note weekly FVG SIBI (right). Simultaneously, note 1D BA FVG SIBI (left).
Break below April 19 validated shorts
On standby. Just day trades , which i don't post here.

NQ Outlook 4/28Bearish on NQ. PDAs as identified. Trying not to spend too much time predicting the narrative at the beginning of the week, however price is likely to interact with these zones.

NQM2024(NASDAQ100)I think price take the Buyside Liquidity and going to Daily FVG.. then going to Sellside liquidity equal Lows.

NQ sellMonthly, Weekly, Daily Breaker Overlap with fvg.
hopefully ENTRY COMES AT 10-11 OR 2-4 FOR TE UNICORN MODEL.

NQ Power Range Report with FIB Ext - 5/3/2024 SessionCME_MINI:NQM2024
- PR High: 17808.00
- PR Low: 17722.00
- NZ Spread: 192.50
Key economic calendar events (loaded Friday)
08:30 | Average Hourly Earnings
- Nonfarm Payrolls
Unemployment Rate
- 09:45 | S&P Global Services PMI
10:00 | ISM Non-Manufacturing PMI
- ISM Non-Manufacturing Prices
AMP margins increase for expected vol spike
- Pushed value back into week highs
- Quick supply response above prev 2 session highs
- Ranging around prev session high
Evening Stats (As of 1:45 AM)
- Weekend Gap: +0.16 (filled)
- Gap 5/2 +0.07% (filled)
- Gap 10/30 +0.47% (open < 14272)
- Session Open ATR: 309.57
- Volume: 27K
- Open Int: 236K
- Trend Grade: Bull
- From BA ATH: -5.0% (Rounded)
Key Levels (Rounded - Think of these as ranges)
- Long: 18675
- Mid: 18106
- Short: 16963
Keep in mind this is not speculation or a prediction. Only a report of the Power Range with Fib extensions for target hunting. Do your DD! You determine your risk tolerance. You are fully capable of making your own decisions.
BA: Back Adjusted
BuZ/BeZ: Bull Zone / Bear Zone
NZ: Neutral Zone
