NQH2017 trade ideas

NQ remains relatively stronger to ESSpreader's delight. the Long NQ, Short ES spread continues to work in favor of the tech bulls.

NQ Power Range Report with FIB Ext - 4/24/2024 SessionCME_MINI:NQM2024
- PR High: 17698.50
- PR Low: 17664.00
- NZ Spread: 77.0
Key economic calendar events
08:30 | Durable Goods Orders
10:30 | Crude Oil Inventories
Daily gap up print of ~65 points, 0.35% from prev close
- Climbing above prev session high
- Inside lows of 4/17 range
Evening Stats (As of 12:05 AM)
- Weekend Gap: N/A
- Gap 10/30 +0.47% (open < 14272)
- Session Open ATR: 295.59
- Volume: 30K
- Open Int: 254K
- Trend Grade: Bull
- From BA ATH: -5.1% (Rounded)
Key Levels (Rounded - Think of these as ranges)
- Long: 18675
- Mid: 18106
- Short: 16963
Keep in mind this is not speculation or a prediction. Only a report of the Power Range with Fib extensions for target hunting. Do your DD! You determine your risk tolerance. You are fully capable of making your own decisions.
BA: Back Adjusted
BuZ/BeZ: Bull Zone / Bear Zone
NZ: Neutral Zone

Idea from FVG on M5 to Relative Equal Highs Idea from FVG on M5 to Relative Equal Highs
Price reached order block on weekly. We may see some measure of retracement.

NQ Weekly Levels (Apr21-26)Here are my levels after a few weeks off. Bullish trend was broken with the drop below the upward trendline. Now trading below key emas. Green box represents important support as price pulls back to key fibs and the 200 sma. Watch for outsized move in either direction due to option volatility. Bounce back into the ema cloud or break of support are equally possible.
SUMMARY
NQ posted a 5.47% loss last week after trading in a huge 1236 pt range.
NQ closed below the 2021 high & the 9/21/55 emas.
R2 = MTF 236 Fib RT (17644)
R1= Dec 29th High (17415)
S1 = MTF 382 Fib RT (17016)
S2= 200 SMA (16770)
Bias is down to sideways as upward trendline has been broken.
200 SMA price magnet in play
Strong bounce from 200 sma/ trendline support is possible
Econ data this week includes PMI on Tues, GDP on Thurs & PCE on Friday
Huge week for earnings with Mega caps reporting including MSFT, TSLA, GOOGL & META.
Global event risk is high
Rate sentiment has changed from rate cut to rate hold or raise due to persistant inflation.
RSI 28.76| VIX at 18.70 | 10 year 4.62%

Daily Demand Zone mitigated now can we SCALE LONG this week...?CME_MINI:NQ1!
"Never let the fear of striking out get in your way." - Babe Ruth
I'm truly interested in going long on this asset... Being that Sellers dropped the Market off a Cliff...
When the market opened up on Sunday April 14th, 2024 last week Sellers held the stronger hand and dropped the market off a cliff... Pushing price all the way down into an Unmitigated Daily Demand zone... Now i'm going to scale down to the LTF 15-5m and wait for a confirmation entry.... Preferably a nice 15m CHoCh & Break of the 1Hr Supply Zone then i'll be interested in going LONG....LETs stay focused and see what PA will give us this week....
Its time to reach EXCELLENCE!! Stay Focused!! -Management500K
#BHM500K #NewERA #Champions


NASDAQ PMI SHORT PLAYPlaying this off the bearish order flow with a retrace back to previous day prices of interest. Target is below previous low's. Expecting NQ to melt.

NQ Power Range Report with FIB Ext - 4/23/2024 SessionCME_MINI:NQM2024
- PR High: 17371.75
- PR Low: 17329.25
- NZ Spread: 95.0
Key economic calendar events
09:45 | S&P Global US Manufacturing PMI
- S&P Global Services PMI
10:00 | New Home Sales
Prev session closed as double wick inside bar
- Holding near prev session close
Evening Stats (As of 12:05 AM)
- Weekend Gap: N/A
- Gap 4/18 +0.04% (open < 17665)
- Gap 10/30 +0.47% (open < 14272)
- Session Open ATR: 290.59
- Volume: 26K
- Open Int: 264K
- Trend Grade: Bull
- From BA ATH: -7.3% (Rounded)
Key Levels (Rounded - Think of these as ranges)
- Long: 18675
- Mid: 18106
- Short: 16963
Keep in mind this is not speculation or a prediction. Only a report of the Power Range with Fib extensions for target hunting. Do your DD! You determine your risk tolerance. You are fully capable of making your own decisions.
BA: Back Adjusted
BuZ/BeZ: Bull Zone / Bear Zone
NZ: Neutral Zone

NQ Scalping Zones 4/22NQ Scalping zones on 15min. Downward pressure continues after breaking below that FEB low. 17113 and 17056 are next downside targets if 17160 fails. If 17160 holds look for upside targets 17288 - 17366.
Follow Jbetrading for more in depth analysis across various asset classes.

Nasdaq 4h Daily Commentary
"#Nasdaq : On the 4-hour chart, there's a clear indication that the price continues to move downwards. If we are bearish, I expect to see the price fill the liquidity gap and then break the previous low, directing the liquidity in Tue 16 Orderblock. However, if we break the last bearish defense in the chart, it will lead us to anticipate a rally upwards. I will provide daily updates on the 4-hour charts. If you have any questions or something you would like me to include in my analysis tomorrow, please leave it in the comment section below.
Good luck to everyone in their trading endeavors!"

Nasdaq Little pop uptoday we see in the charts in 8hrs the posibility of a bottom, a good close in a green hammer.
the market have been goign down a lot. but i think we might push up.
in blue we have entry and in red stop loss. target in green.
Elektra 33

NASDAQ - Bounce and Lower Low incoming this weekJust a quick demonstration...
Accouding to the TD Setup rules, a normally perfected TD Buy Setup would see the lowest point of the 8th and 9th candle be lower than the lowest point of the 6th and 7th candle. This to say, if it is normally projectable, then there would be a Lower Low point less than 17113 over the next three days, if not another three days after that (likely, this week).
So, the red box should be pierced through.
Watch for it...

NQ1! SENDS CLEAR BULLISH SIGNALS|LONG
Hello,Friends!
NQ1! pair is in the downtrend because previous week’s candle is red, while the price is obviously falling on the 9H timeframe. And after the retest of the support line below I believe we will see a move up towards the target above at 17886.00 because the pair oversold due to its proximity to the lower BB band and a bullish correction is likely.
✅LIKE AND COMMENT MY IDEAS✅

A+ setup clean price action,short NQweekly SSMT,5min breaker block entry,target on new week opening gap

NQ Long Using Fib Retracement, Order Blocks, Price ActionTook a long on NQ. Before taking this trade on NQ I saw it retested in inbalance zone but waiting to go long to see where price action will hit on Fibonacci retracement. I saw price action hit a 0.382% Fibonacci level indicating a strong trend to the upside. Aiming my TP at an Order Block that is shown on the 15min, 30min, and 1hr time frames. Based on the Smart Money Concepts or ICT, price will fill the liquidity of the OB but I will play it safe and aim half way of the Order Block. My entry is the green arrow, My stop loss is the red line, and TP is the green line. Will see if my prediction is correct!
Indicators used to to take this Long Position are
- Fibonacci Retracement
- Retesting of Inbalance Zones, FVGs, etc.. (ICT or Smart Money Concepts)
- Price Action
- Support & Resistance

Nasdaq Idea - Short MNQ 17332Rationale:
Internal Resistance High: The internal resistance high at 17322 serves as a critical level where selling pressure is likely to intensify. Traders can capitalize on this level by initiating short positions, anticipating a reversal in price action.
Session Timing: The trade idea is particularly relevant during the Asian and London sessions, where liquidity and volatility are generally higher. This timeframe enhances the effectiveness of technical levels like the identified resistance, increasing the probability of a successful trade.
Risk Management: By placing a stop loss at 17355, traders can limit potential losses in case the market moves against the anticipated direction. This disciplined approach to risk management ensures that losses are kept within acceptable limits.
Conclusion:
In conclusion, the MNQ presents a compelling short opportunity during the London session, with the internal resistance high at 17322 serving as a key level for traders to monitor. By entering a short position near this level and implementing appropriate risk management measures, traders can potentially profit from the anticipated downward movement, targeting 17260 as the initial objective. This analysis is valid for trading on April 22, 2024, and aligns with the prevailing market conditions and technical dynamics.
Disclaimer: Trading involves risk, and past performance is not indicative of future results. Traders should conduct their own research and consider their risk tolerance before executing any trades.

NQ Power Range Report with FIB Ext - 4/22/2024 SessionCME_MINI:NQM2024
- PR High: 17263.00
- PR Low: 17196.00
- NZ Spread: 150.0
No key economic calendar event
Volatile open creating relatively wide range
- Holding above Friday's close
- Value declined back to Dec-Jan range
Evening Stats (As of 12:05 AM)
- Weekend Gap: N/A
- Gap 4/18 +0.04% (open < 17665)
- Gap 10/30 +0.47% (open < 14272)
- Session Open ATR: 291.55
- Volume: 37K
- Open Int: 267K
- Trend Grade: Bull
- From BA ATH: -7.7% (Rounded)
Key Levels (Rounded - Think of these as ranges)
- Long: 18675
- Mid: 18106
- Short: 16963
Keep in mind this is not speculation or a prediction. Only a report of the Power Range with Fib extensions for target hunting. Do your DD! You determine your risk tolerance. You are fully capable of making your own decisions.
BA: Back Adjusted
BuZ/BeZ: Bull Zone / Bear Zone
NZ: Neutral Zone

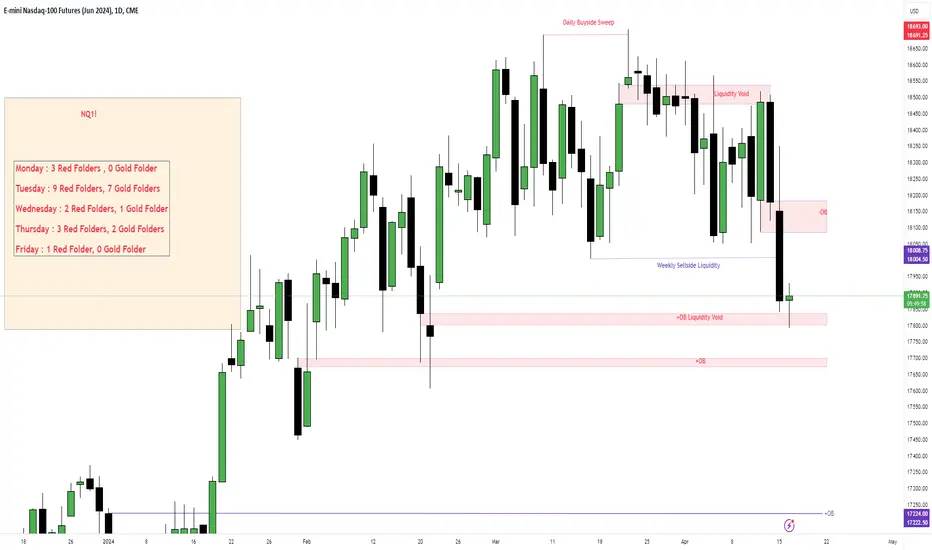
NQ1! - Touch 'N' GoWith minor accumulation, huge manipulation up to 18,350.75 during Mondays trading NQ closed out, distributing below the weekly sellside @ 18,004.50, trading into the daily bullish order block plus liquidity void which seems to be respected today @ 17,837.25 - 17,802.25.
Today is supposed to be a volatile day with 9 red folder events and 7 gold folder events which is supposed to induce liquidity into the market by sweeping stops.
Retracement up to the daily bearish order block @ the 18,100 region is an acceptable relief rally.
My philosophy is simple...
Fortify Michael J Huddlestone's concepts that I have studied to consistently predict where the market is more likely to go.
This includes;
- Market Structure
- Buyside/Sellside Liquidity
- Order Blocks
- Liquidity Voids
- Fair Value Gaps
- Optimal Trade Entry
- Premium/Discount Array
- SIBI/BISI
- Many More!
The strategies mentioned here are some of many that I use to implement into my analysis and over time, with consistency I aim to achieve a high degree of accuracy in the markets with the foresight and understanding to assess what went wrong when my bias is negated.
Credits;
- Michael Joe HUDDLESTONE
- Shawn Lee POWELL
- Toray KORTAN
Nasdaq Weekly Analysis Sure, here's the corrected text:
We see the price bouncing from Mon 10 OCT '22 after a year and a half of bearish market and going directly to retest the all-time high on Mon 22 Nov '21 again by MON 22 JAN '24. However, it starts to move towards a new all-time high, but with limited liquidity hindering further price increase. We've already witnessed a significant bullish move, and it's time for the market to correct itself. We've observed a weekly candle breaking the market structure forcefully towards the order block from Tue 02 Jan '24 and breaking the 50% retracement level from Mon 23 Oct '23 low to the all-time high. We anticipate the price to continue being bearish to shake out buyers and accumulate new liquidity if we aim to reach a new all-time high.
Our focal point in the NASDAQ for the 2Q is the breaker from Mon 24 Jul above the 50% Fibonacci level of the bullish leg and between 0.6/0.7 of the Fibonacci level to turn bullish. Breaking Mon 23 Oct '23 liquidity support would put us in a significantly bearish condition.

NQ - Great move off the weekly 1.27 Fib targetIs a hold above the 16768 area in the cards this week? Or is this the beginning of a move to 13650 at the weekly .618?

daily range interpretationI think we are in a daily rang at the top of the trend, market created new ATH recently but didn't close above the last one so I think market needs to go down to take more liquidity and resume trend

NQ Nasdaq futures: There is a possibility of a selloff looming. NQ Nasdaq futures: There is a possibility of a selloff looming.
On the daily chart we have the first ever volume spike in a long time, thats why i believe we are headed down.
